Deploying NaC Nexus Dashboard
To this point we have completed the following steps:
- Setup Environment: We have set up the environment for Network as Code Nexus Dashboard, including installing Ansible and configuring the necessary files.
- Set Environment Variables: We have set the environment variables required for connecting to Nexus Dashboard and executing the automation.
- Build Data Model: We have built the data model for the VXLAN/EVPN fabric using the information gathered from the CML topology and the requirements for Nexus Dashboard.
Understanding the deployment process
Section titled “Understanding the deployment process”The first thing to remember is that this capability operates using Ansible. This means that the deployment process is based on Ansible playbooks, which are YAML files that define the tasks to be executed. We utilize Ansible roles to structure the playbook. These roles read the data model and execute the necessary tasks to deploy the configuration to Nexus Dashboard.
To recap, the roles that exist for Network as Code Nexus Dashboard are:
Validate Role
Section titled “Validate Role”The validate role ensures that the data model is correct and that the data model can be processed by the subsequent roles. The validate role reads all the files in the host_vars directory and creates a single data model in memory for execution.
Create Role
Section titled “Create Role”The create role builds all of the templates and variable parameters required to deploy the VXLAN fabric and creates fabric state in NDFC. The data model is converted into the proper templates required by the Ansible modules used to communicate with the NDFC controller and manage the fabric state. The create role has a dependency on the validate role.
Deploy Role
Section titled “Deploy Role”The deploy role deploys the fabric state created using the create role to the NDFC managed devices. The deploy role has a dependency on the validate role.
Remove Role
Section titled “Remove Role”The remove role removes state from the NDFC controller and the devices managed by the NDFC controller. When the collection discovers managed state in NDFC that is not defined in the data model it gets removed by this role. For this reason, this role relies on a set of variables that control which operations are performed. These variables are described in the next section, Remove Role NaC for Nexus Dashboard, which explains their purpose and how to configure them in group_vars.. This avoids accidental removal of configuration from NDFC that might impact the network. The remove role has a dependency on the validate role.
Importance of the Validate Role
Section titled “Importance of the Validate Role”The validate role is crucial in the deployment process. It ensures that the data model is correct and can be processed by the subsequent roles. This role performs semantic validation to ensure that the data model matches the intended expected values. It also allows for the creation of rules to prevent operators from making specific configurations that are not allowed in the network, enhancing the reliability and stability of the deployment.
This is the reason that the create, deploy, and remove roles have a dependency on the validate role. If the data model is not valid, the subsequent roles will not be able to execute successfully.
Environment variables and execution
Section titled “Environment variables and execution”The reason to utilize environment variables is to allow for flexibility in the deployment process. While we set the environment variables in the .env file for this local execution, environment variables play a key role to enable the execution of the playbook in different environments, such as CI/CD pipelines.
To be able to execute the automation, some information is required that is sensitive from security perspective. Data such as credentials for the controllers don’t belong in source code. For this reason, utilization of environment variables can be used to avoid having this sensitive information stored in the incorrect locations. Tools like Ansible Vault can be used to encrypt sensitive information, but in this case we are using environment variables to store the sensitive information in a more simplified manner.
Step 1: Verify environment variables
Section titled “Step 1: Verify environment variables”Before proceeding with the deployment, it is essential to verify that the environment variables are set correctly. You can do this by running the following command in the terminal:
source .envenv | grep NDStep 2: View the playbook
Section titled “Step 2: View the playbook”As part of the example repository, we have provided a playbook for deploying the Network as Code Nexus Dashboard. The file is called vxlan.yaml and is located in the root of the cloned repository.
cd ~/network-as-code/nac-ndcode-server vxlan.yamlAs you will see inside the playbook, three roles will be executed:
createdeployremove
The validate role is run automatically via the execution of these roles.
Step 3: Execute the playbook
Section titled “Step 3: Execute the playbook”To execute the playbook, run the following command in the terminal:
ansible-playbook -i inventory.yaml vxlan.yamlYou should see the output indicating the execution of automation. This will take a few minutes to complete. In the end you should see a summary of the tasks executed and their status. This isn’t in order of execution, but rather a summary of the tasks executed by the roles
ROLES RECAP *******************************************************************Monday 07 July 2025 11:27:20 -0400 (0:00:00.056) 0:10:15.832 ***********===============================================================================create ---------------------------------------------------------------- 374.13sdeploy ---------------------------------------------------------------- 193.52scommon ----------------------------------------------------------------- 31.89sremove ------------------------------------------------------------------ 8.22svalidate ---------------------------------------------------------------- 3.46sconnectivity_check ------------------------------------------------------ 2.79scommon_global ----------------------------------------------------------- 0.04s~~~~~~~~~~~~~~~~~~~~~~~~~~~~~~~~~~~~~~~~~~~~~~~~~~~~~~~~~~~~~~~~~~~~~~~~~~~~~~~total ----------------------------------------------------------------- 614.04sWhat happened in the background?
Section titled “What happened in the background?”The playbook execution follows the Nexus Dashboard methodology. For this reason there are stages in the execution. The two primary stages are:
- Creation of the fabric state in Nexus Dashboard
- Deployment of the fabric state to the devices managed by Nexus Dashboard
Nexus Dashboard
Section titled “Nexus Dashboard”If you haven’t connected yet to Nexus Dashboard, you should do so now.
| Component | Description | URL | Credential |
|---|---|---|---|
| Nexus Dashboard | The central management platform for the VXLAN/EVPN fabric. | Nexus Dashboard | Username: adminPassword: C1sco12345 |
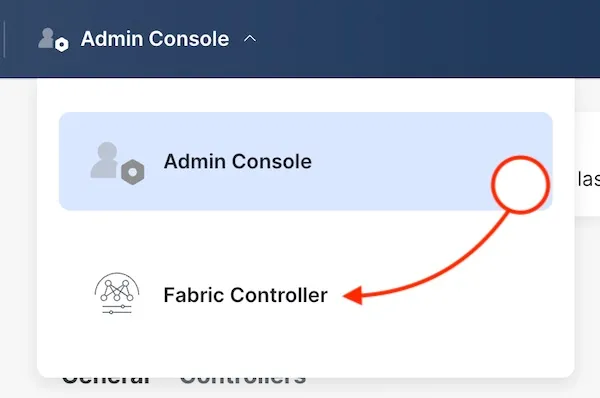
Once you have logged in, you will switch into the Fabric view.
Switch Inventory
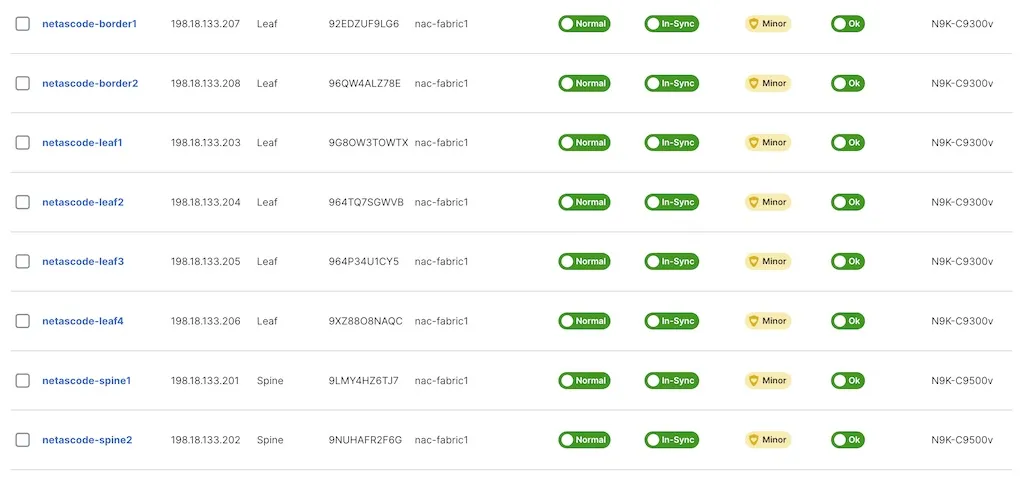
Section titled “Switch Inventory”Once inside the Fabric view, you can look at the switch inventory for the switches that Network as Code Nexus Dashboard has created.
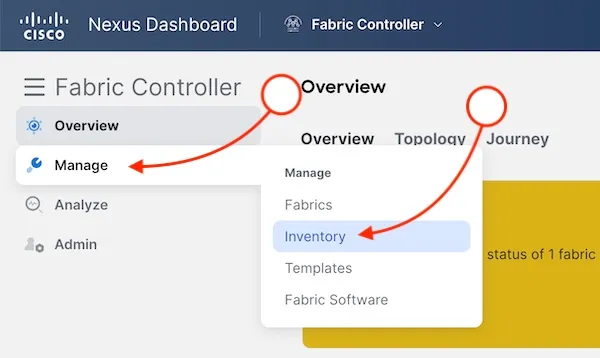
Which provides you with a list of the switches that are part of the fabric.
Connect to a switch
Section titled “Connect to a switch”| Switch name | Connection URL |
|---|---|
| netascode-leaf1 | URL |
| netascode-leaf2 | URL |
| netascode-leaf3 | URL |
| netascode-leaf4 | URL |
| netascode-spine1 | URL |
| netascode-spine2 | URL |
| netascode-border1 | URL |
| netascode-border2 | URL |
If you connect to netascode-leaf1, you will see the configuration that was deployed to the switch by Nexus Dashboard.
Commands you can run:
show running-configshow bgp l2vpn evpn summaryFabric State
Section titled “Fabric State”To reach the fabric details, click on the fabrics on the manage menu.
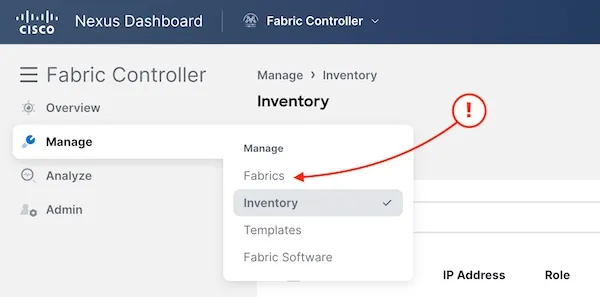
Then click on the fabric name and the link to fabric details.

Here you can now see the fabric settings that have been passed to Nexus Dashboard from Network as Code Nexus Dashboard.
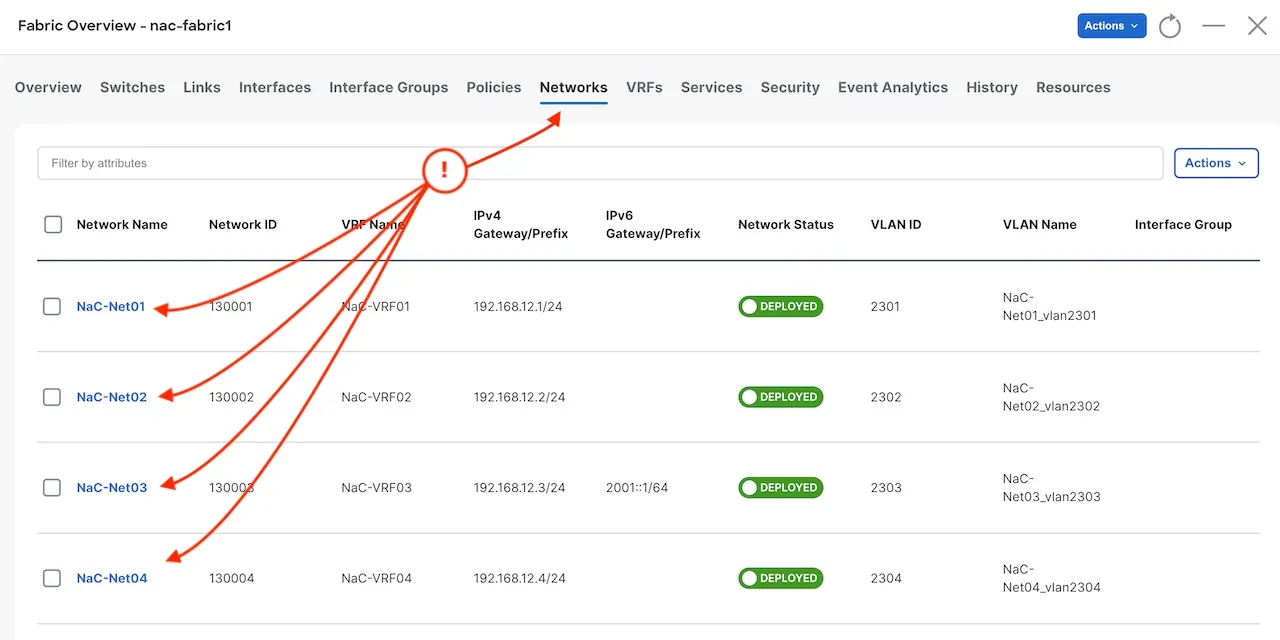
Network configuration
Section titled “Network configuration”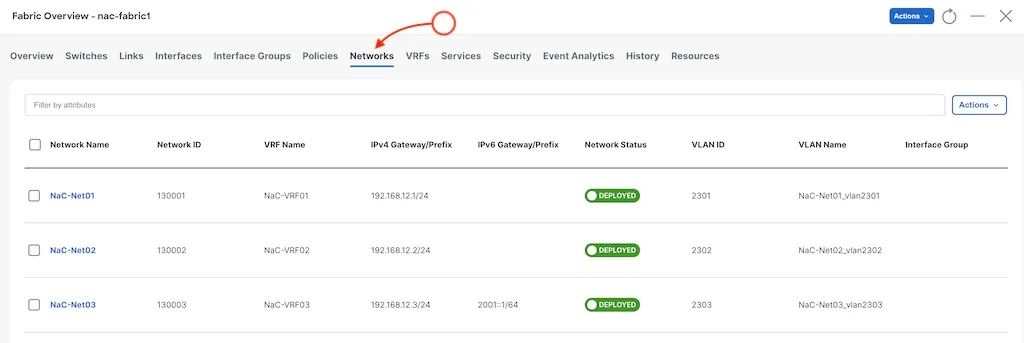
As you can see, the example data model included configuration to create networks in Nexus Dashboard. You can view this file in the data model.
cd ~/network-as-code/nac-ndcode-server host_vars/nac-fabric1/networks.nac.yamlIn that file you will see the following in the YAML structure:
---vxlan: overlay: networks: - name: NaC-Net01 vrf_name: NaC-VRF01 net_id: 130001 vlan_id: 2301 vlan_name: NaC-Net01_vlan2301 gw_ip_address: "192.168.12.1/24" network_attach_group: all[cut]The top of the tree will always be vxlan for this data model. In this case since we are adding networks, these are part of the overlay. In the tree this makes the topology:
---vxlan: overlay: networks:This is then followed by a list of networks. The dash under networks indicates that this is a list. From a high level view you could think of it as:
vxlan: overlay: networks: - name: NaC-Net01 - name: NaC-Net02 - name: NaC-Net03This structure creates three networks [NaC-Net01, NaC-Net02, NaC-Net03]. In these we have the attributes required. Important elements to note are:
vrf_name: The name of the VRF that the network is associated with.net_id: The VXLAN Network Identifier (VNI) for the network.vlan_id: The VLAN ID for the network.
When you are working with the data model, you can reference the online data model documentation to understand the attributes and their usage. As mentioned before the data model for VXLAN/EVPN fabric is available in the Overlay Networks Model Documentation. In each page there is a table available that describes the attributes.
This table looks like the following:
| Name | Type | Constraint | Mandatory | Default Value |
|---|---|---|---|---|
| name | String | Yes | ||
| is_l2_only | Boolean | true, false | No | false |
| vrf_name | String | No | ||
| net_id | Integer | min: 1, max: 16777214 | No | |
| vlan_id | Integer | min: 1, max: 4094 | No | |
| vlan_name | String | No | ||
| gw_ip_address | IP | No | ||
| arp_suppress | Boolean | true, false | No | |
| dhcp_loopback_id | Integer | min: 0, max: 1023 | No | |
| dhcp_servers | List | [dhcp_servers] | No | |
| gw_ipv6_address | String | No | ||
| int_desc | String | No | ||
| l3gw_on_border | Boolean | true, false | No | false |
| mtu_l3intf | Integer | No | 9216 | |
| multicast_group_address | IP | No | 239.1.1.1 | |
| netflow_enable | Boolean | true, false | No | false |
| route_target_both | Boolean | true, false | No | false |
| route_tag | Integer | min: 0, max: 4294967295 | No | 12345 |
| secondary_ip_addresses | List | [secondary_ip_addresses] | No | |
| trm_enable | Boolean | true, false | No | false |
| vlan_netflow_monitor | String | No | ||
| child_fabrics | List | [child_fabrics] | No | |
| network_attach_group | String | No |
As you can see some of the attributes are mandatory. In this case for the network, the name is the only mandatory attribute. You will also see that there are default values for some of the attributes. Without a definition in the YAML file, the default value will be used.
- name: NaC-Net02 vrf_name: NaC-VRF02 net_id: 130002 vlan_id: 2302 vlan_name: NaC-Net02_vlan2302 gw_ip_address: "192.168.12.2/24" network_attach_group: leaf1Also related to Nexus Dashboard is the concept of Network Attach Groups. These are groups of switches that are used to attach networks to the fabric. In the data model, you can define these groups under the network_attach_groups section. The network attach groups are defined in the example repository as:
network_attach_groups: - name: all switches: - { hostname: netascode-leaf1, ports: [Ethernet1/13, Ethernet1/14] } - { hostname: netascode-leaf2, ports: [Ethernet1/13, Ethernet1/14] } - name: leaf1 switches: - { hostname: netascode-leaf1, ports: [] } - name: leaf2 switches: - { hostname: netascode-leaf2, ports: [] }With this definition, you can see that in the example the attach group points to leaf1. This attach group defines that it attaches to the switch netascode-leaf1. This allows the user to define which switches you are using.
VRF Configuration
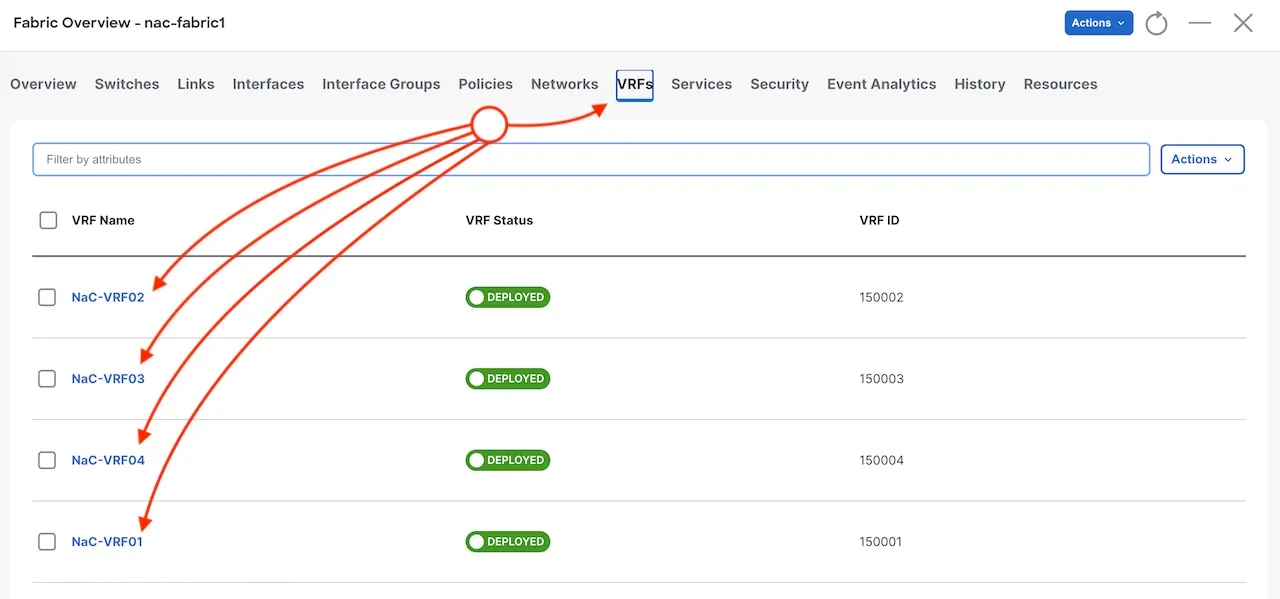
Section titled “VRF Configuration”With the example of the network, you can also see the VRF configuration that has been deployed by Network as Code Nexus Dashboard. The VRF configuration is defined in the data model under the vrfs section.
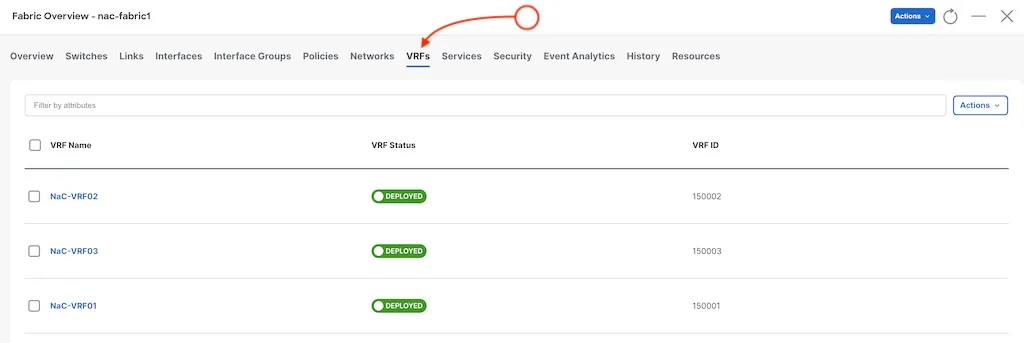
In the same manner, the data model defines the VRFs also under the overlay section.
---vxlan: overlay: vrfs: - name: NaC-VRF01 vrf_id: 150001 vlan_id: 2001 vrf_attach_group: allVRFs also have attributes that are mandatory and attach groups to define them to the specific fabric switches. The attributes for the VRF are defined in the data model documentation under Overlay VRFs Model Documentation.
Adding more networks and VRFs
Section titled “Adding more networks and VRFs”For this document we have only used the defined networks and VRFs that are part of the example data model. In this section you will add an additional network and VRF to the fabric. This will allow you to see how easy it is to extend the fabric with new networks and VRFs.
Step 1: Add a new VRF
Section titled “Step 1: Add a new VRF”Open the host_vars/nac-fabric1/vrfs.nac.yaml file in your code editor:
cd ~/network-as-code/nac-ndcode-server host_vars/nac-fabric1/vrfs.nac.yamlIn the open file you will see all the VRFs that are declared. You are going to add an additional VRF (NaC-VRF04). You will be adding another VRF that is a listed under the vrfs section. The - indicates that this is a list. Each item on the list starts with a -. Each of the VRFs in that list is a defined map or dictionary of attributes. So you will located the last VRF (NaC-VRF03) and add the new VRF below it.
- name: NaC-VRF04 vrf_id: 150004 vlan_id: 2004 vrf_attach_group: allBecause you are adding it to the existing attach_group all, you don’t need to add to the network_attach_groups section.
Step 2: Add a new network
Section titled “Step 2: Add a new network”For the network you will be adding a new network (NaC-Net04) that is associated with the new VRF (NaC-VRF04). Doing the same method as before, you are adding a network to a list of networks. These are defined under the overlay section in the data model.
Open the host_vars/nac-fabric1/networks.nac.yaml file in your code editor:
cd ~/network-as-code/nac-ndcode-server host_vars/nac-fabric1/networks.nac.yaml - name: NaC-Net04 vrf_name: NaC-VRF04 net_id: 130004 vlan_id: 2304 vlan_name: NaC-Net04_vlan2304 gw_ip_address: "192.168.12.4/24" network_attach_group: allYou are also associating it with the all attach group, so you don’t need to add it to the network_attach_groups section.
Step 3: Deploy the changes
Section titled “Step 3: Deploy the changes”To deploy the changes, you will run the same playbook as before.
cd ~/network-as-code/nac-ndansible-playbook -i inventory.yaml vxlan.yamlYou should see the output indicating the execution of automation. This will take a few minutes to complete. In the end you should see a summary of the tasks executed and their status.
Step 4: Verify the changes
Section titled “Step 4: Verify the changes”You can verify in the Nexus Dashboard Controller that the new VRF and network have been created. You can do this by going to the Fabric view and checking the VRFs and Networks sections.
From Manage click on Fabrics and then click on the fabric name.

Here there are two TABS you can check: VRFs and Networks.
