Pipelines with NaC for Nexus Dashboard
This guide demonstrates how to implement a working CI/CD pipeline for your Network as Code Nexus Dashboard project using GitLab. Building on the concepts from Understanding Pipelines, we’ll transform your existing workspace into a production-ready, version-controlled project with automated validation, deployment, and testing capabilities.
Why Implement CI/CD for Network Operations?
Section titled “Why Implement CI/CD for Network Operations?”In the previous section, you learned about the theoretical benefits of automation pipelines for network operations. Now we’ll put those concepts into practice. By the end of this section, you’ll have:
- Automated Validation: Every configuration change will be automatically validated against schema and business rules
- Controlled Deployment: Changes will only deploy after passing all validation checks and manual approval
- Comprehensive Testing: Post-deployment testing will verify that your intended configuration matches the actual network state
- Complete Auditability: Every change, test result, and deployment will be tracked and documented
This practical implementation bridges the gap between traditional network change management and modern Infrastructure as Code practices.
Starting Point: Your Workspace
Section titled “Starting Point: Your Workspace”In the code server environment, you already have your working NaC VXLAN configuration. Let’s prepare this for version control and CI/CD.
Access Code Server
Section titled “Access Code Server”You will now access the web IDE interface you accessed previously to work with your Network as Code VXLAN ND project.
| Component | Description | URL | Credential |
|---|---|---|---|
| Code Server | Web-based VS Code instance pre-configured for Network as Code development. | Code Server | Password: C1sco12345 |
Your workspace should have declared network state under the host_vars/nac-fabric1 directory. The main Ansible playbook is vxlan.yaml, and the inventory file is inventory.yaml. You can see the list of files in your workspace by running the following commands in the terminal:
cd ~/network-as-code/nac-ndls -laDirectory contents
Section titled “Directory contents”.env— Environment variables file containing credentials and connection details.git/— Git repository metadata (version control tracking).gitignore— Git ignore rules (specifies files to exclude from version control).gitlab-ci.yml— GitLab CI/CD pipeline configuration (defines automation workflow).pabotsuitenames— Robot Framework parallel test execution metadata.python-version— Python version specifier from pyenv (ensures consistent Python environment)ansible.cfg— Ansible configuration file (customizes Ansible behavior)ansible.log— Ansible execution log file (generated during playbook runs)collections/— Ansible collections directory (downloaded collection dependencies)group_vars/— Group variable definitions (shared configuration across device groups)host_vars/— Host variable definitions (device-specific configuration, includes declared network state undernac-fabric1)inventory.yaml— Ansible inventory file (defines target devices and groups)ndfc_validate.yaml— ND validation playbook (implements the validate stage from pipeline concepts)README.md— Project documentationrequirements.txt— Python dependenciesrequirements.yaml— Ansible collection dependenciesschema/— Schema definitions (used for data model validation)tests/— Test templates and results (implements the testing stage from pipeline concepts)vxlan.yaml— Main Ansible playbook (implements the deployment stage from pipeline concepts)
Understanding the Pipeline Integration
Section titled “Understanding the Pipeline Integration”Your workspace already contains a .gitlab-ci.yml file that implements the four-stage pipeline we discussed:
- Setup Stage: Prepares the execution environment and installs dependencies
- Validate Stage: Uses
ndfc_validate.yamlto check data model correctness - Deploy Stage: Uses
vxlan.yamlto apply configuration to network devices - Test Stage: Uses templates in
tests/to verify deployment success
This practical implementation brings the theoretical pipeline concepts into a working automation framework.
Creating a GitLab Project and Preparing Your Workspace
Section titled “Creating a GitLab Project and Preparing Your Workspace”Understanding Git and GitLab in Network Operations Context
Section titled “Understanding Git and GitLab in Network Operations Context”Before diving into the setup, it’s important to understand why we’re using Git and GitLab for network configuration management:
Git provides version control - the ability to track every change to your network configuration over time. This means you can:
- See exactly what changed between any two versions of your network state
- Rollback to previous configurations if needed
- Collaborate with team members without conflicts
- Maintain a complete audit trail of all network changes
GitLab provides the CI/CD platform that automates our pipeline processes:
- Automatically validates configuration changes before they’re applied
- Provides controlled deployment workflows with approval gates
- Runs comprehensive testing after deployments
- Maintains artifacts and reports for compliance and troubleshooting
This combination transforms network operations from manual, error-prone processes to automated, reliable workflows.
Step 1: Login to GitLab instance
Section titled “Step 1: Login to GitLab instance”Before you can use version control and create CI/CD pipelines, you need a remote repository to store your code and manage collaboration. So we are going to create a GitLab project. This provides:
A central place to store and back up your code
Collaboration features for teams
Integration with GitLab CI/CD to automate configuration validation, deployment, and testing
Visibility and history of all changes made to your project
Component Description URL Credential GitLab Git repository management and CI/CD pipeline platform for Network as Code. GitLab Username: labuser
Password:C1sco12345
Step 2: Create a new GitLab project
Section titled “Step 2: Create a new GitLab project”After you have logged into GitLab you will create a new project.
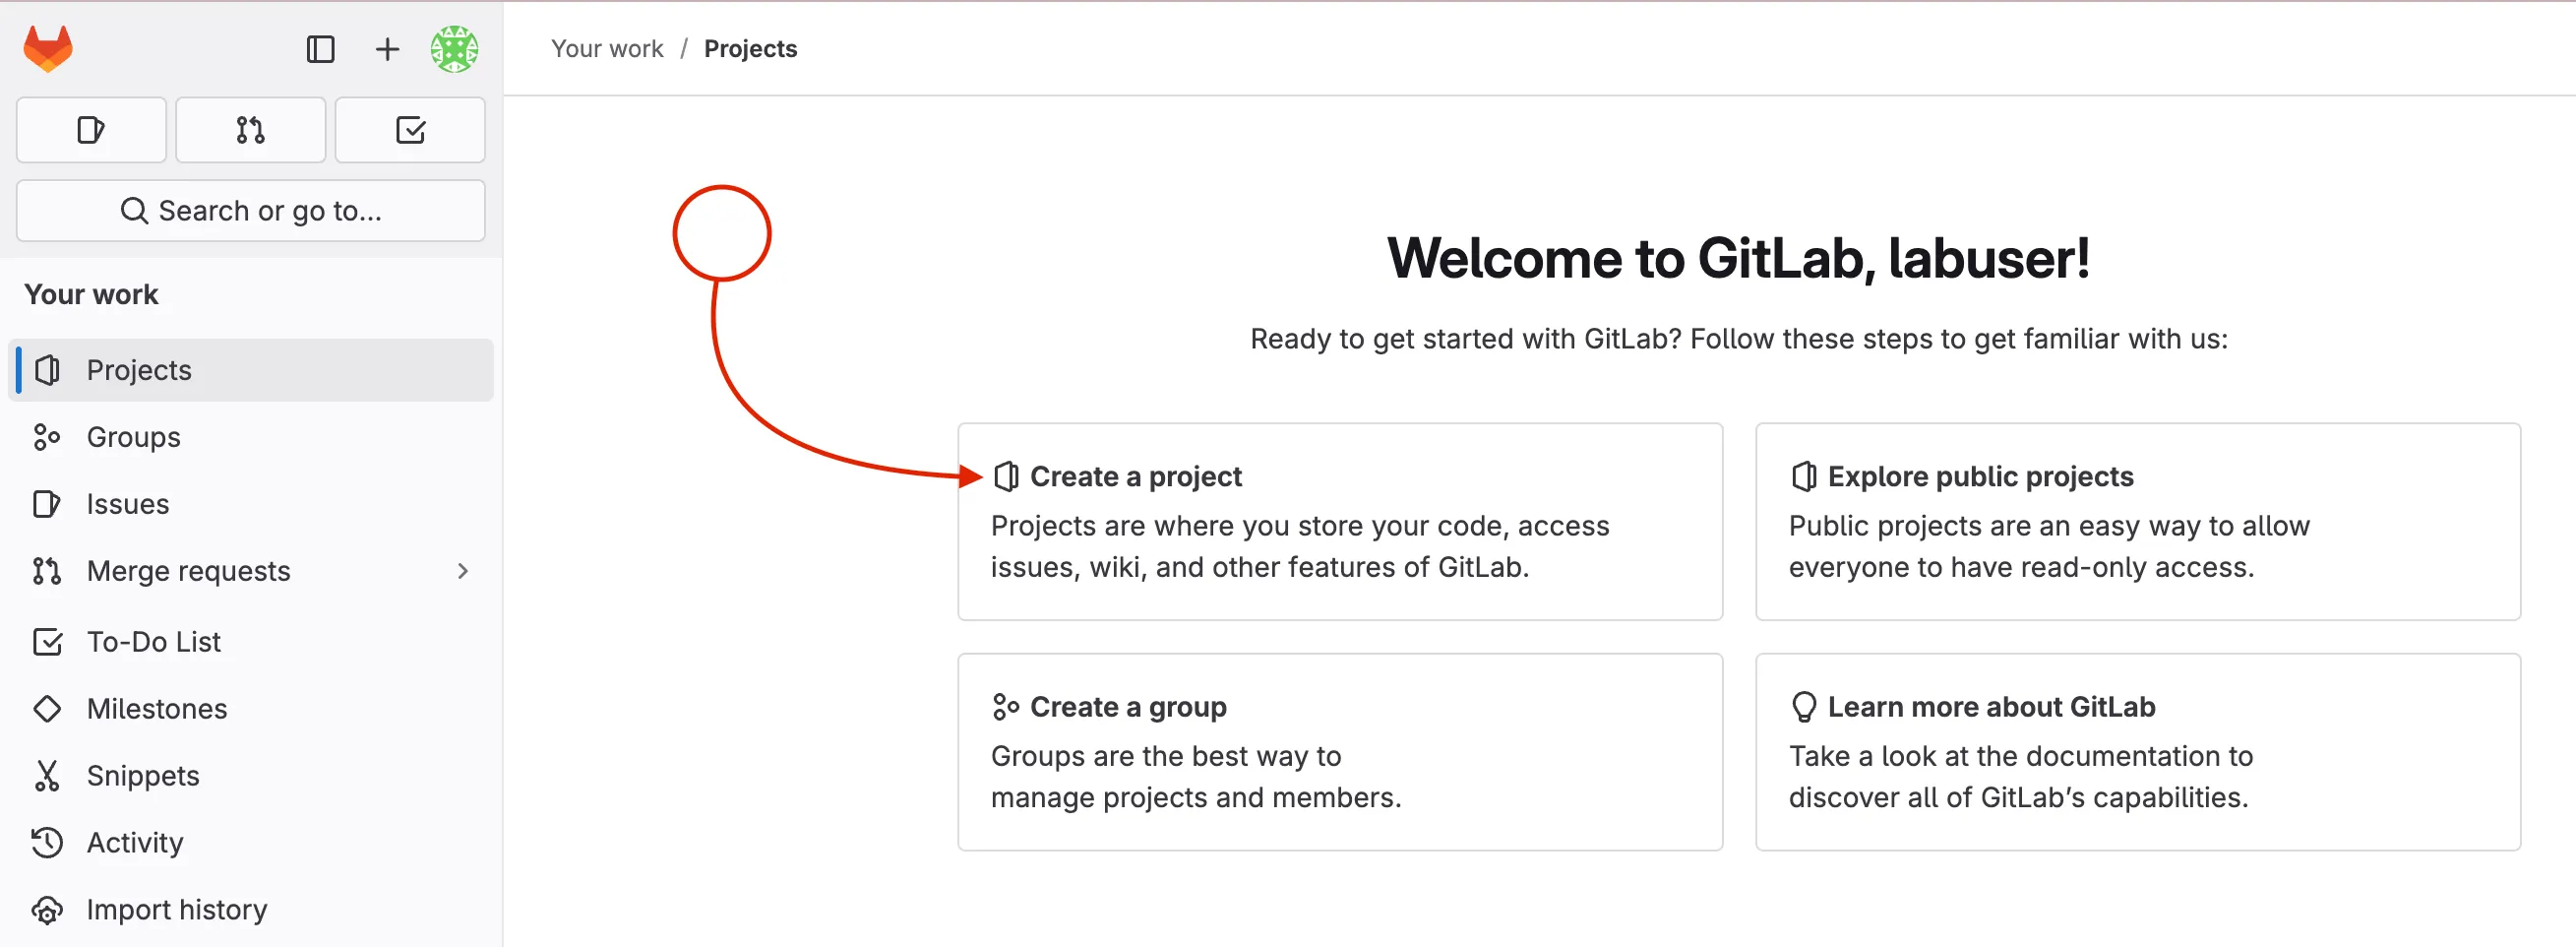
- Click Create a project to start a new project
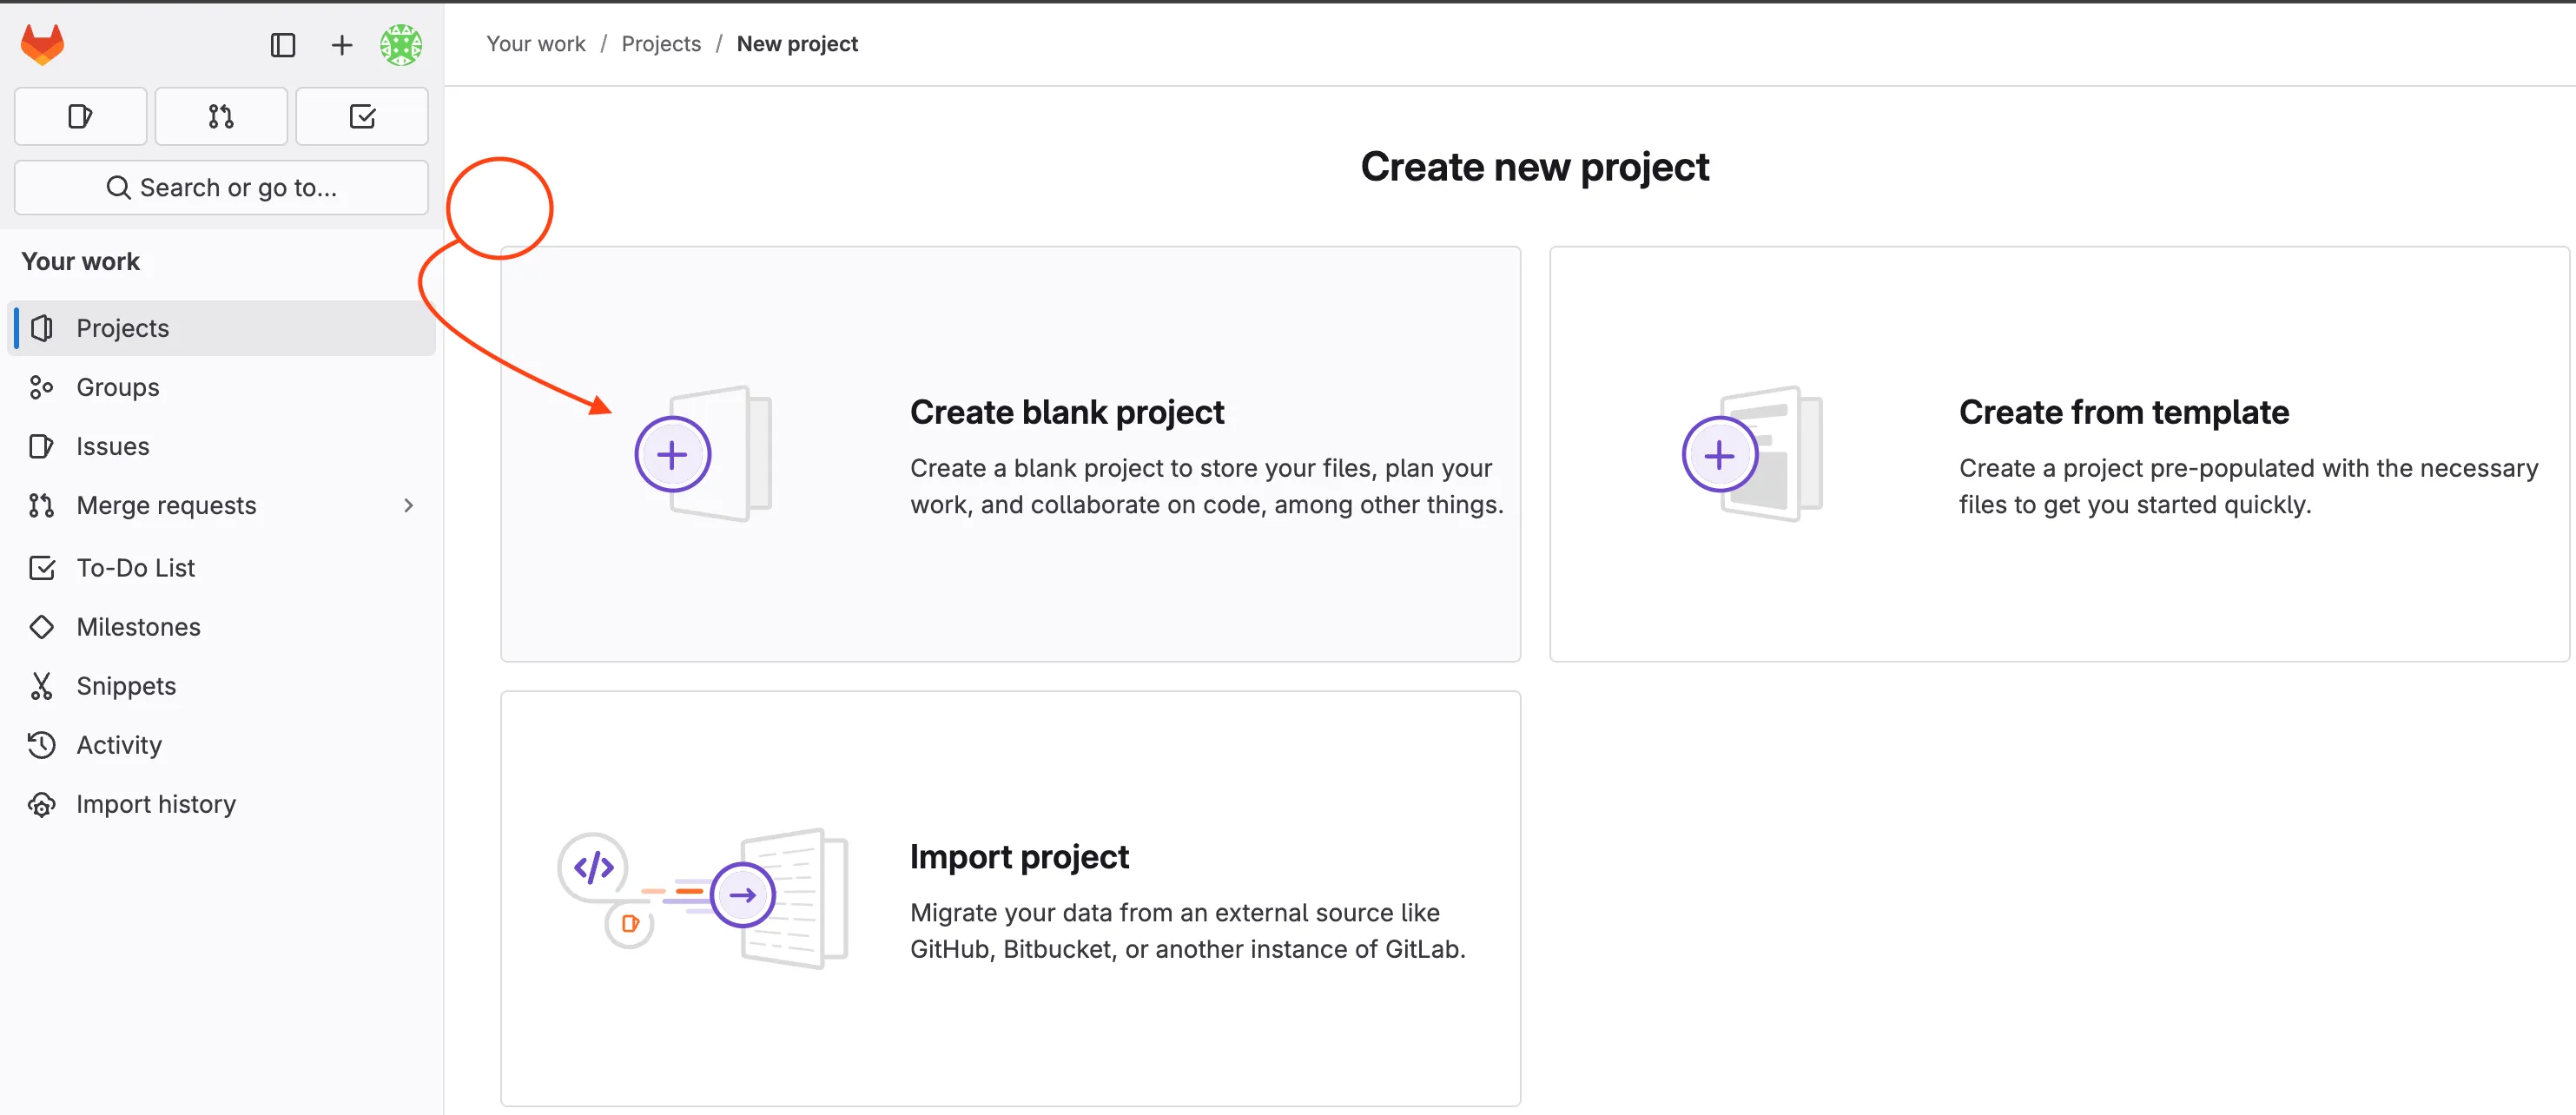
- Choose Create blank project to start with an empty repository. This is ideal for our use case where we will push existing code from the code server.
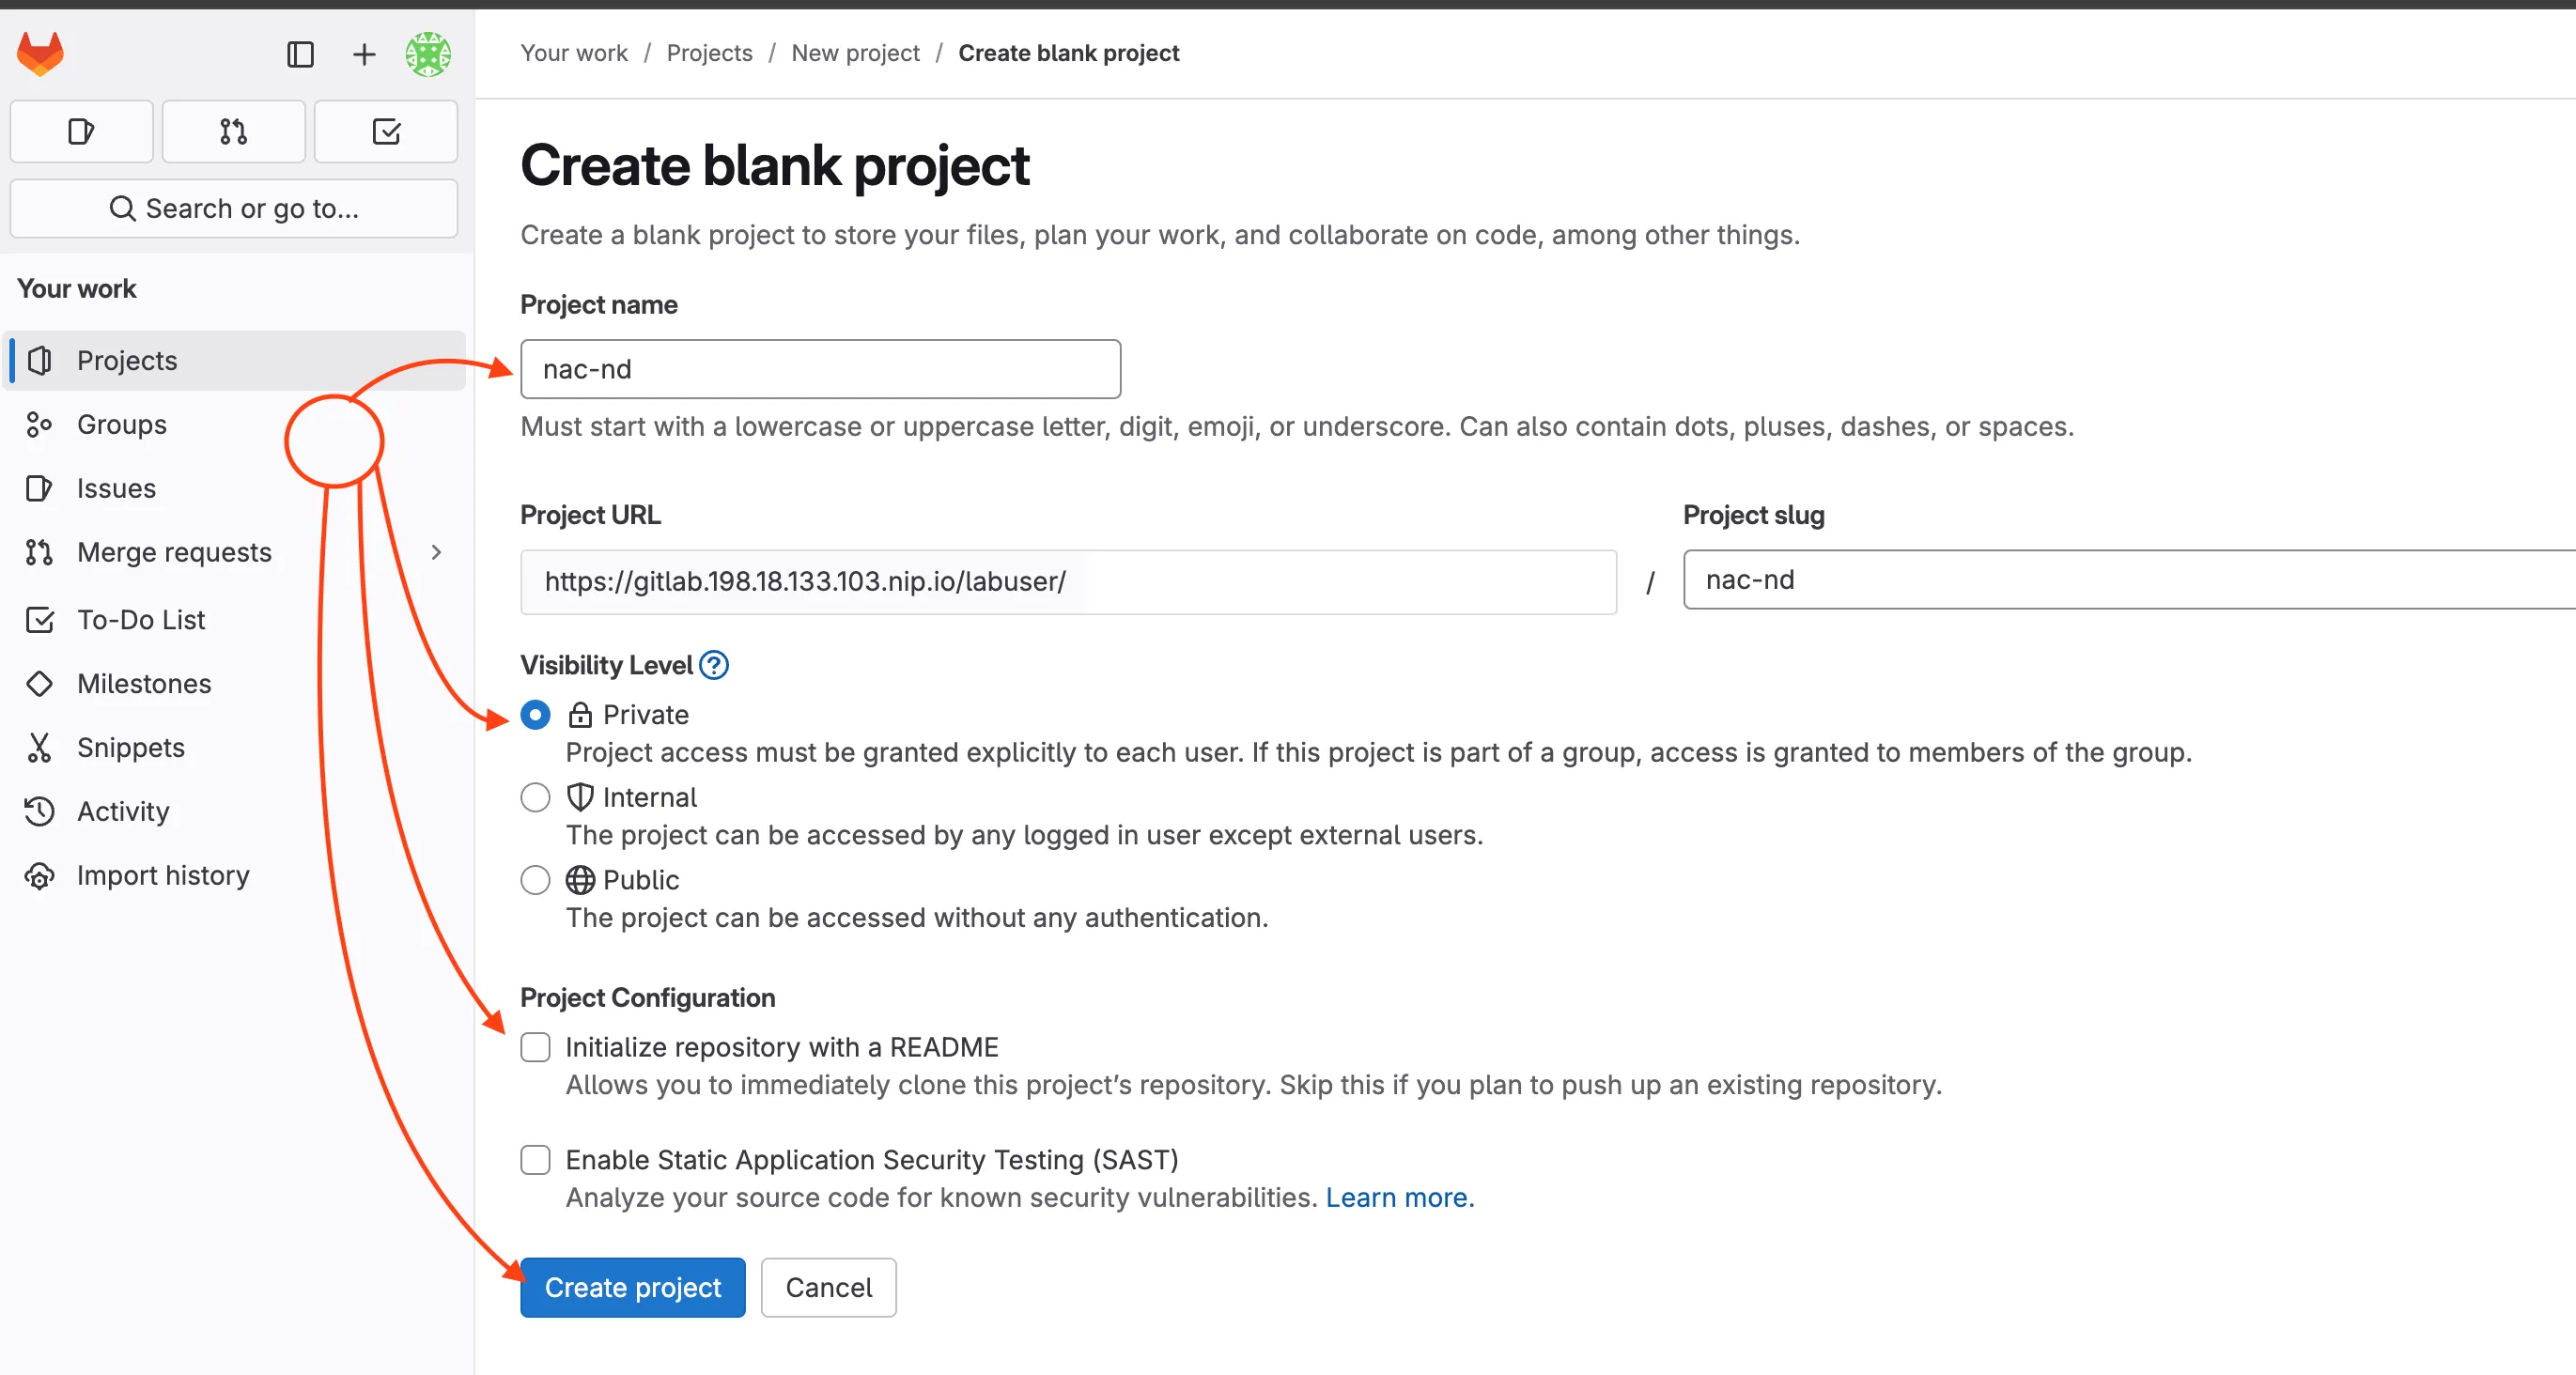
- Enter the project name (e.g.,
nac-nd) - Set visibility to Private (to restrict access to your project to only you and authorized users)
- Uncheck the Initialize repository with a README option (since you will push your existing code)
- Click Create project to finalize the project creation.
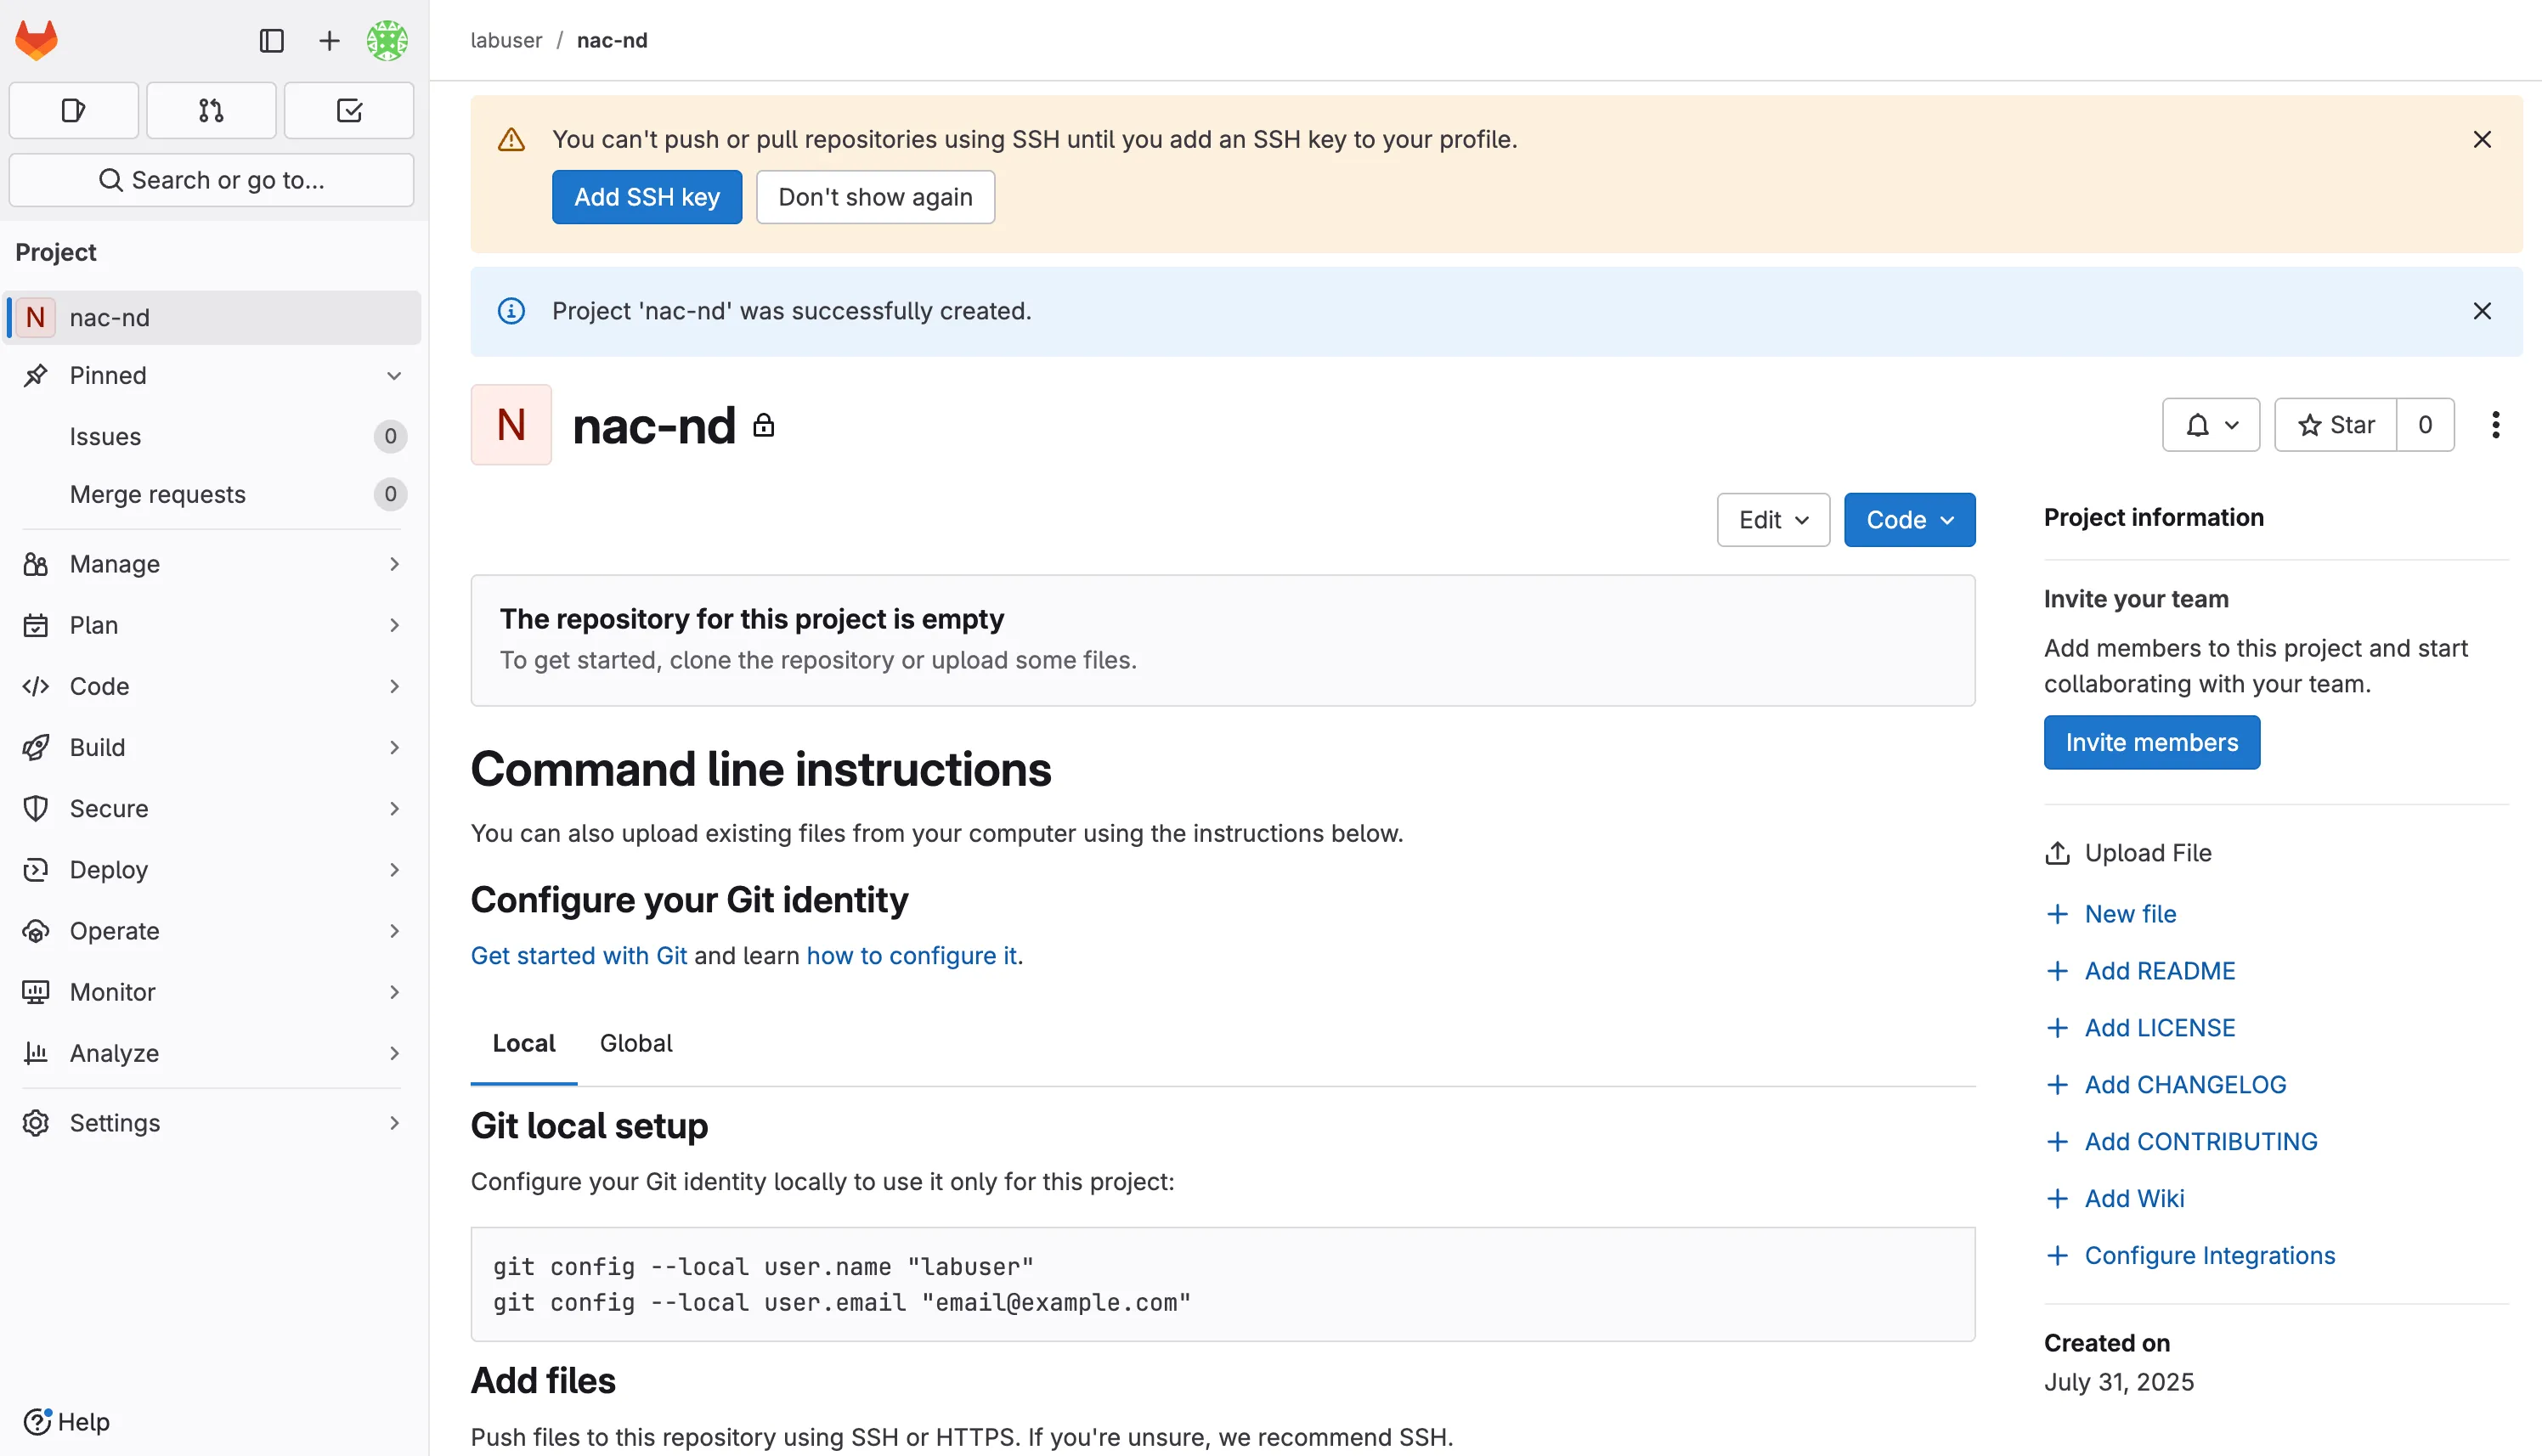
You should see an empty project page with instructions to push existing code. This is where you will connect your code server workspace to this new GitLab project.
Step 3: Check if GIT is already initialized
Section titled “Step 3: Check if GIT is already initialized”When you set up your workspace in the Setup NaC ND section, you cloned the NetAsCode example repository. This gave you the working code, but it also connected your workspace to the original NetAsCode repository on GitHub.
Now we want to disconnect from that repository and connect to your new GitLab project instead. In the previous steps we deleted the .git directory. While there are advanced Git commands to change the repository URL, for better understanding in simple terms we will just initialize a new repository.
First, let’s see what repository is currently connected:
Open the Code Server and navigate to your workspace directory:
cd ~/network-as-code/nac-ndCheck the current Git remote connection (this shows the repository from the previous setup section):
git remote -vIf you see the following output, you missed the step to remove the .git directory in the previous section:
origin https://github.com/netascode/ansible-dc-vxlan-example (fetch)origin https://github.com/netascode/ansible-dc-vxlan-example (push)Delete the GIT directory:
Open the Code Server and navigate to your workspace directory:
cd ~/network-as-code/nac-ndRemove the existing Git tracking (this removes the connection to the original NetAsCode repository):
rm -rf .gitWhy do this? The
.gitdirectory contains all the version control history and remote connections. By removing it, we start with a clean slate for your own project.
Step 4: Initialize GIT repository
Section titled “Step 4: Initialize GIT repository”Initialize a new Git repository with main as the default branch:
cd ~/network-as-code/nac-ndgit init --initial-branch=mainWhat this does: Creates a new Git repository in your current directory. The
--initial-branch=mainoption sets the default branch name to “main” (rather than the older default “master”). This command creates the.gitdirectory and sets up the basic Git structure needed to track changes to your files.
Step 5: Configure GIT identity
Section titled “Step 5: Configure GIT identity”Configure your Git user identity:
git config --global user.name "labuser"git config --global user.email "labuser@example.com"git config --global http."https://gitlab.198.18.133.103.nip.io/".sslVerify falseWhat this does: Sets your identity for Git commits. Every commit in Git is associated with an author, and these commands tell Git who you are. The
--globalflag means this configuration applies to all Git repositories on this system, not just the current one. When you make commits, they’ll be attributed to “labuser” with the email “labuser@example.com”. SSL bypass verification is used to push changes to the gitlab server. This information appears in the Git history and is important for collaboration and audit trails.
Warning: Disabling SSL verification is not safe for production use. Use this workaround only in the lab and rely on proper certificates in real environments.
Step 6: Configure .gitignore
Section titled “Step 6: Configure .gitignore”When working with a GIT repository, it is important to exclude certain files and directories from being tracked in the repository. These are files that could be generated during automation execution, files that are not relevant to be stored that are part of execution, temporary files, or files that contain sensitive information. If you look the repository already contains a .gitignore file, but it is missing some exclusions that we want to show you. Also this step introducues you to the concept of .gitignore files.
Update the .gitignore file to exclude test results and temporary files:
cd ~/network-as-code/nac-ndcat << EOF >> .gitignore.pabotsuitenamestests/results/ansible.logcollections/EOFStep 7: Configure remote GIT repository server in GitLab
Section titled “Step 7: Configure remote GIT repository server in GitLab”In your GitLab project page, copy the repository URL (e.g., https://gitlab.198.18.133.103.nip.io/labuser/nac-nd.git)
Add your GitLab project as the remote repository:
git remote add origin https://gitlab.198.18.133.103.nip.io/labuser/nac-nd.gitWhat this does: Connects your local Git repository to the remote GitLab repository. “origin” is the conventional name for your primary remote repository, and this URL tells Git where to push and pull changes. Think of this as linking your local workspace to your GitLab project on the GitLab Server.
Verify the remote was added correctly:
git remote -vYou should see your GitLab URL:
origin https://gitlab.198.18.133.103.nip.io/labuser/nac-nd.git (fetch)origin https://gitlab.198.18.133.103.nip.io/labuser/nac-nd.git (push)This confirms you’ve successfully switched from the example repository to your own GitLab project!
Step 8: Add and commit your files
Section titled “Step 8: Add and commit your files”Add all your project files to Git tracking:
git add .git commit -m "Initial commit"What this does: The
git add .command stages all files in your current directory for commit (the.means “everything here”). Thegit commitcommand creates a snapshot of your staged changes with a descriptive message. This creates your first commit containing all your Network as Code configuration files, making them part of your Git history.
Push your code and set the upstream branch:
git push --set-upstream origin mainWhat this does: Uploads your local commits to the GitLab repository. The
--set-upstream origin mainpart establishes a tracking relationship between your localmainbranch and the remotemainbranch, so futuregit pushandgit pullcommands know where to send/receive changes.
This streamlined approach ensures you have a clean start with your own GitLab project, avoiding any confusion with existing remotes or Git history.
Step 9: Verify GitLab Integration
Section titled “Step 9: Verify GitLab Integration”Since your workspace already contains a .gitlab-ci.yml file, the pipeline should have triggered automatically when you pushed. Let’s verify the setup:
Verify the Push Success: Navigate to your GitLab project in the browser to confirm all files are present.
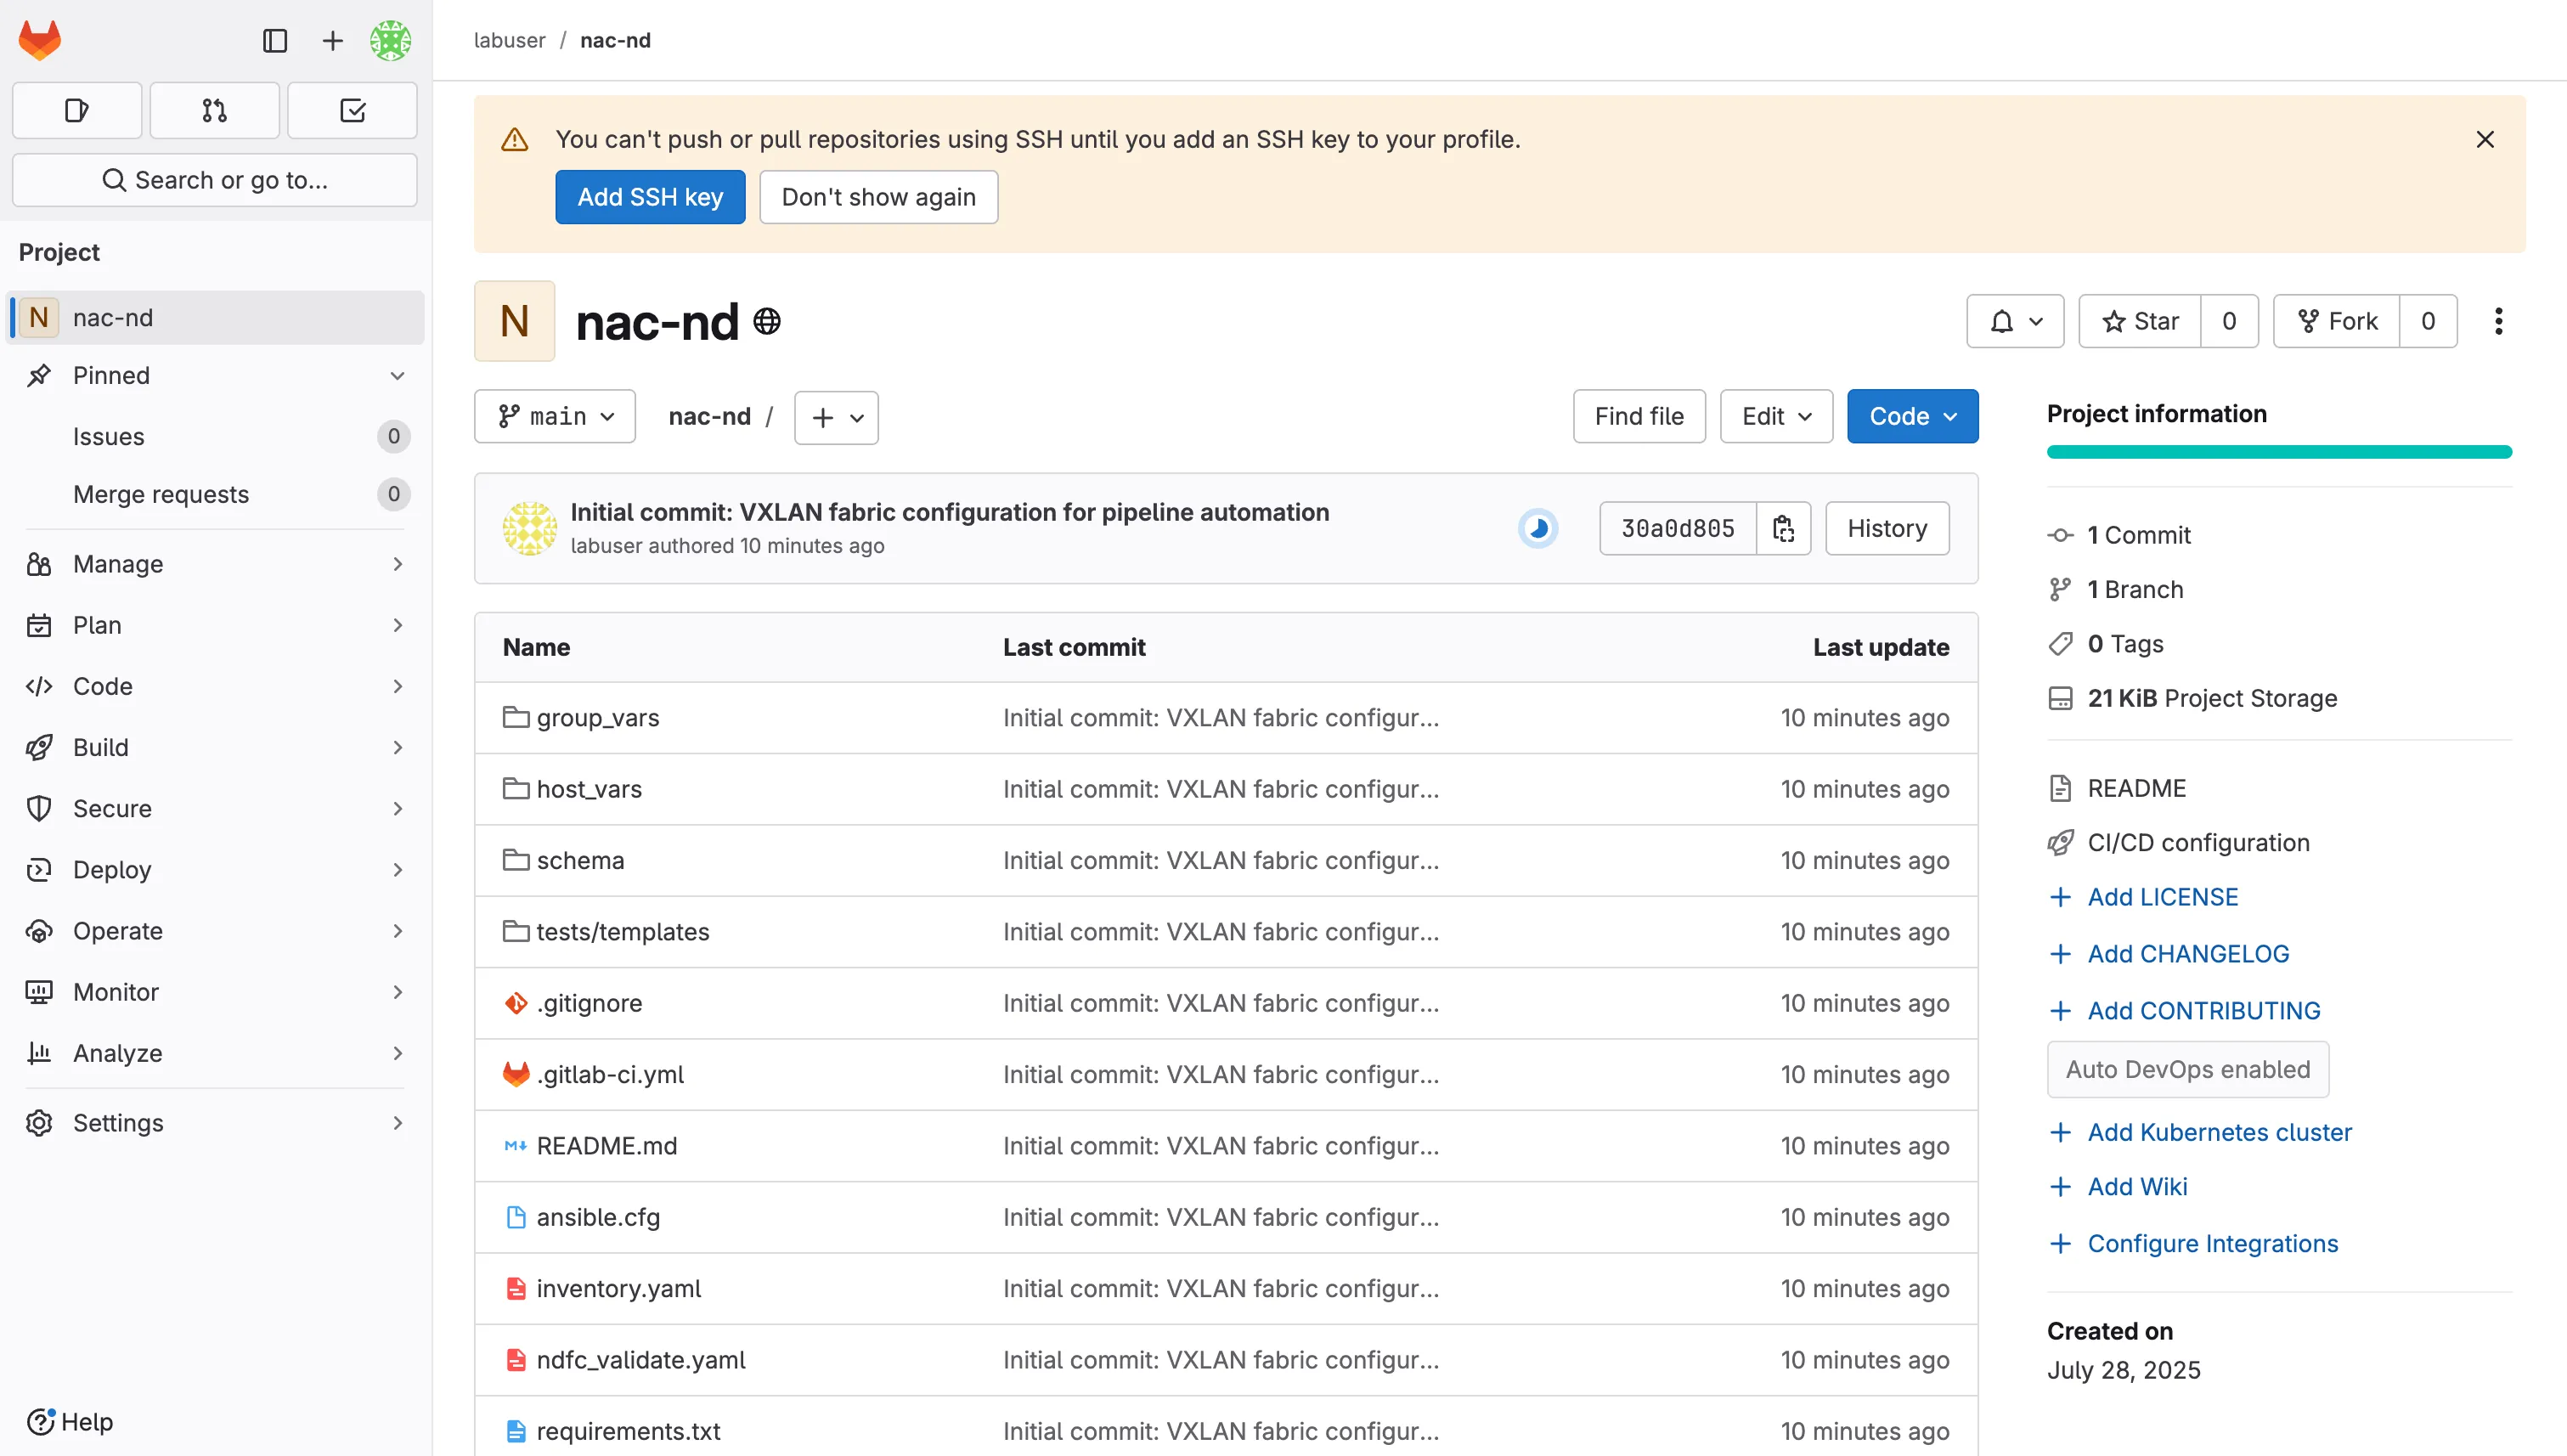
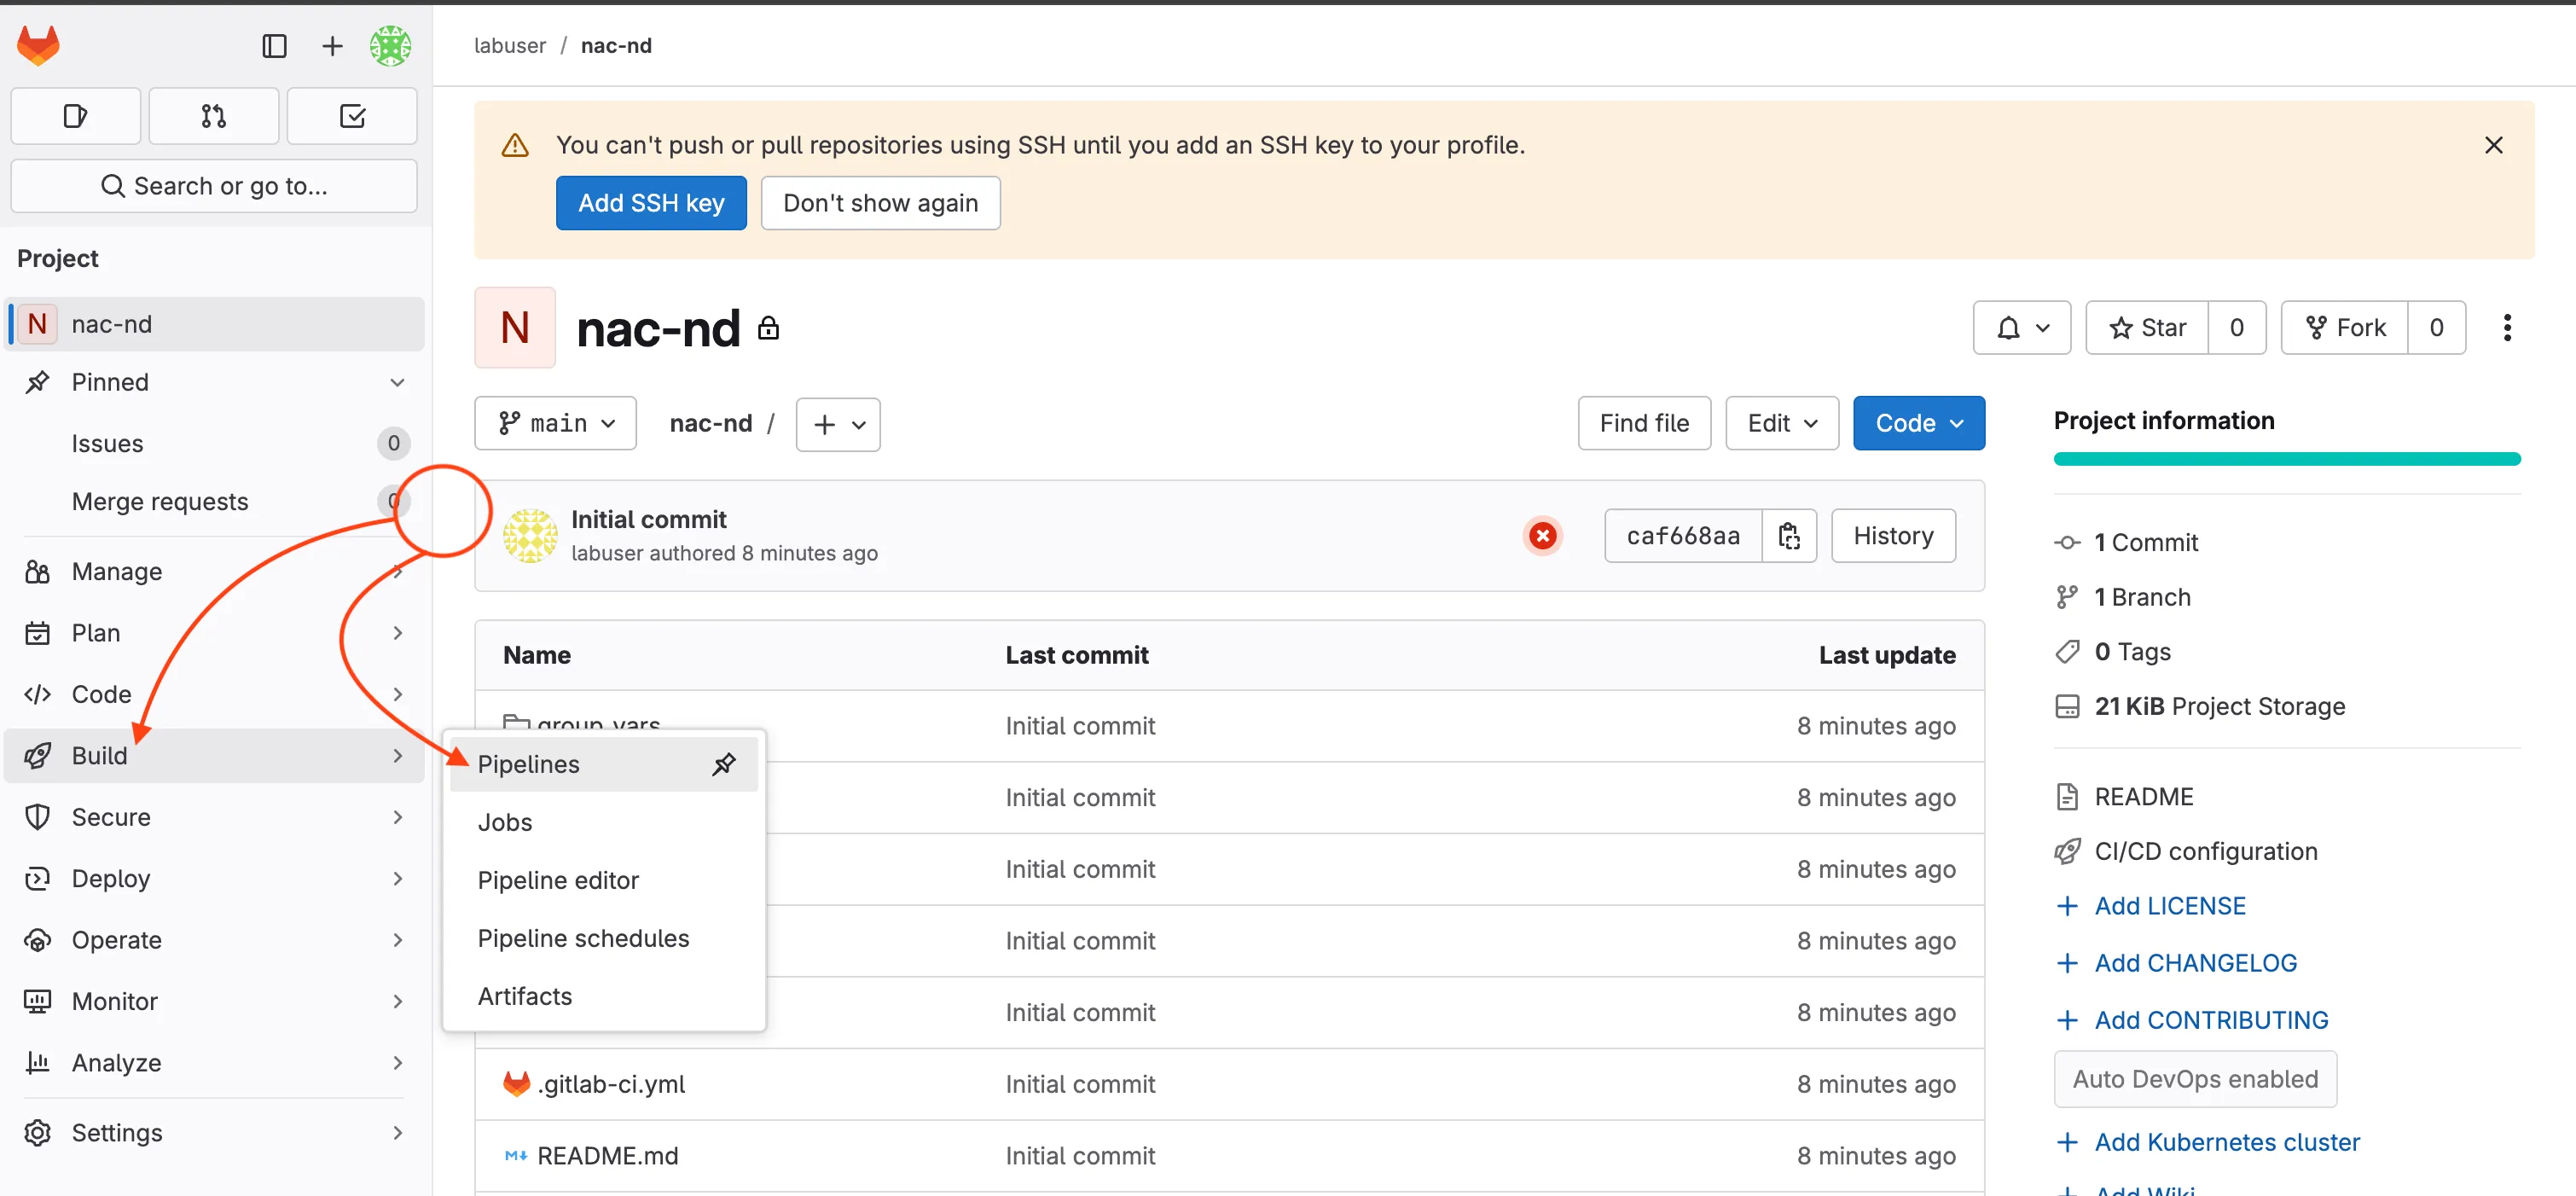
Expected Pipeline Behavior: Since you pushed with a .gitlab-ci.yml file, GitLab will automatically start a pipeline. This first pipeline will likely fail because the CI/CD variables are not configured yet. This is normal and expected.
- Go to Build > Pipelines in your GitLab project to see the pipeline status
- The pipeline failure is expected at this point - we’ll fix it by configuring variables next
💡 Understanding Pipeline Triggers:
GitLab automatically triggers pipelines when you push commits that include a
.gitlab-ci.ymlfile. Since your workspace already has this file, the pipeline will run immediately. The initial failure is normal and will be resolved once you configure the required variables.

Configuring CI/CD Variables in GitLab
Section titled “Configuring CI/CD Variables in GitLab”GitLab CI/CD variables provide a secure way to store sensitive information like credentials and configuration parameters that your pipeline needs to execute. These variables are encrypted and can be masked in logs to prevent accidental exposure.
Why use CI/CD variables instead of storing credentials in code?
- Security: Credentials are encrypted and separated from your code repository
- Flexibility: Different environments (dev, staging, production) can use different values
- Compliance: Sensitive data is not stored in version control history
- Team Collaboration: Team members can access the pipeline without seeing sensitive credentials
Step 10: Set variables in GitLab
Section titled “Step 10: Set variables in GitLab”Navigate to your GitLab project and configure the following variables:
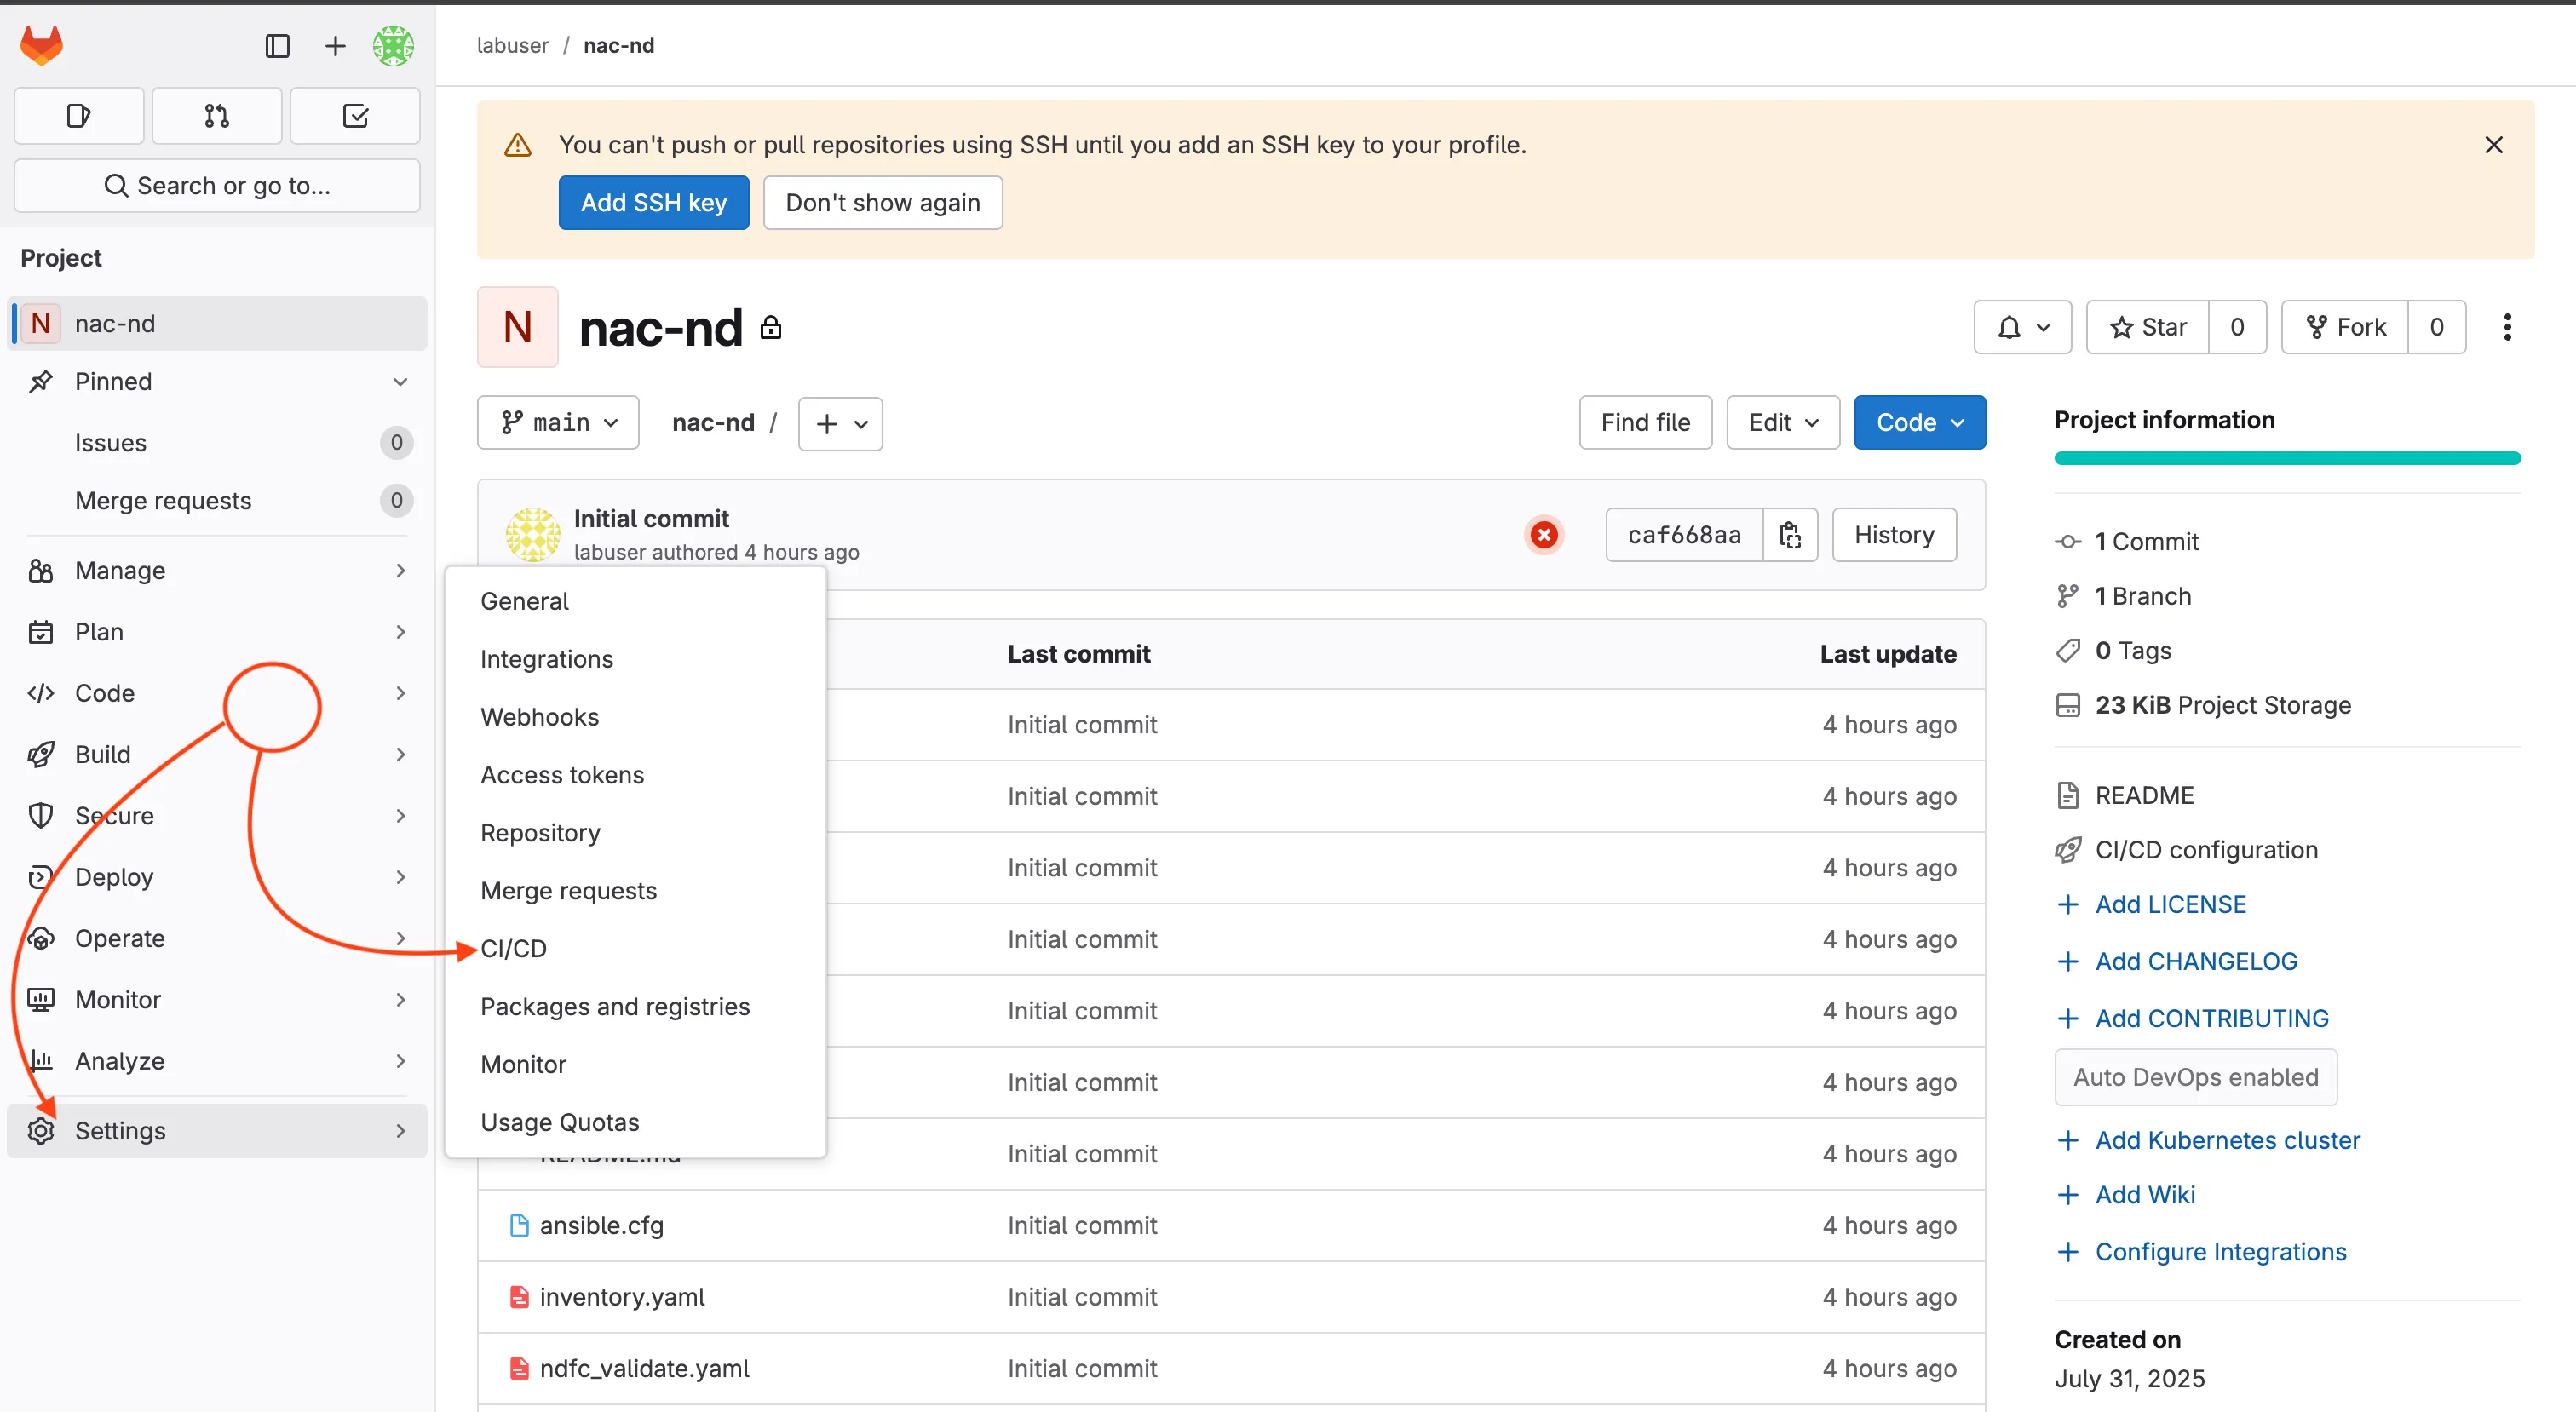
In your GitLab project, go to Settings > CI/CD in the left sidebar
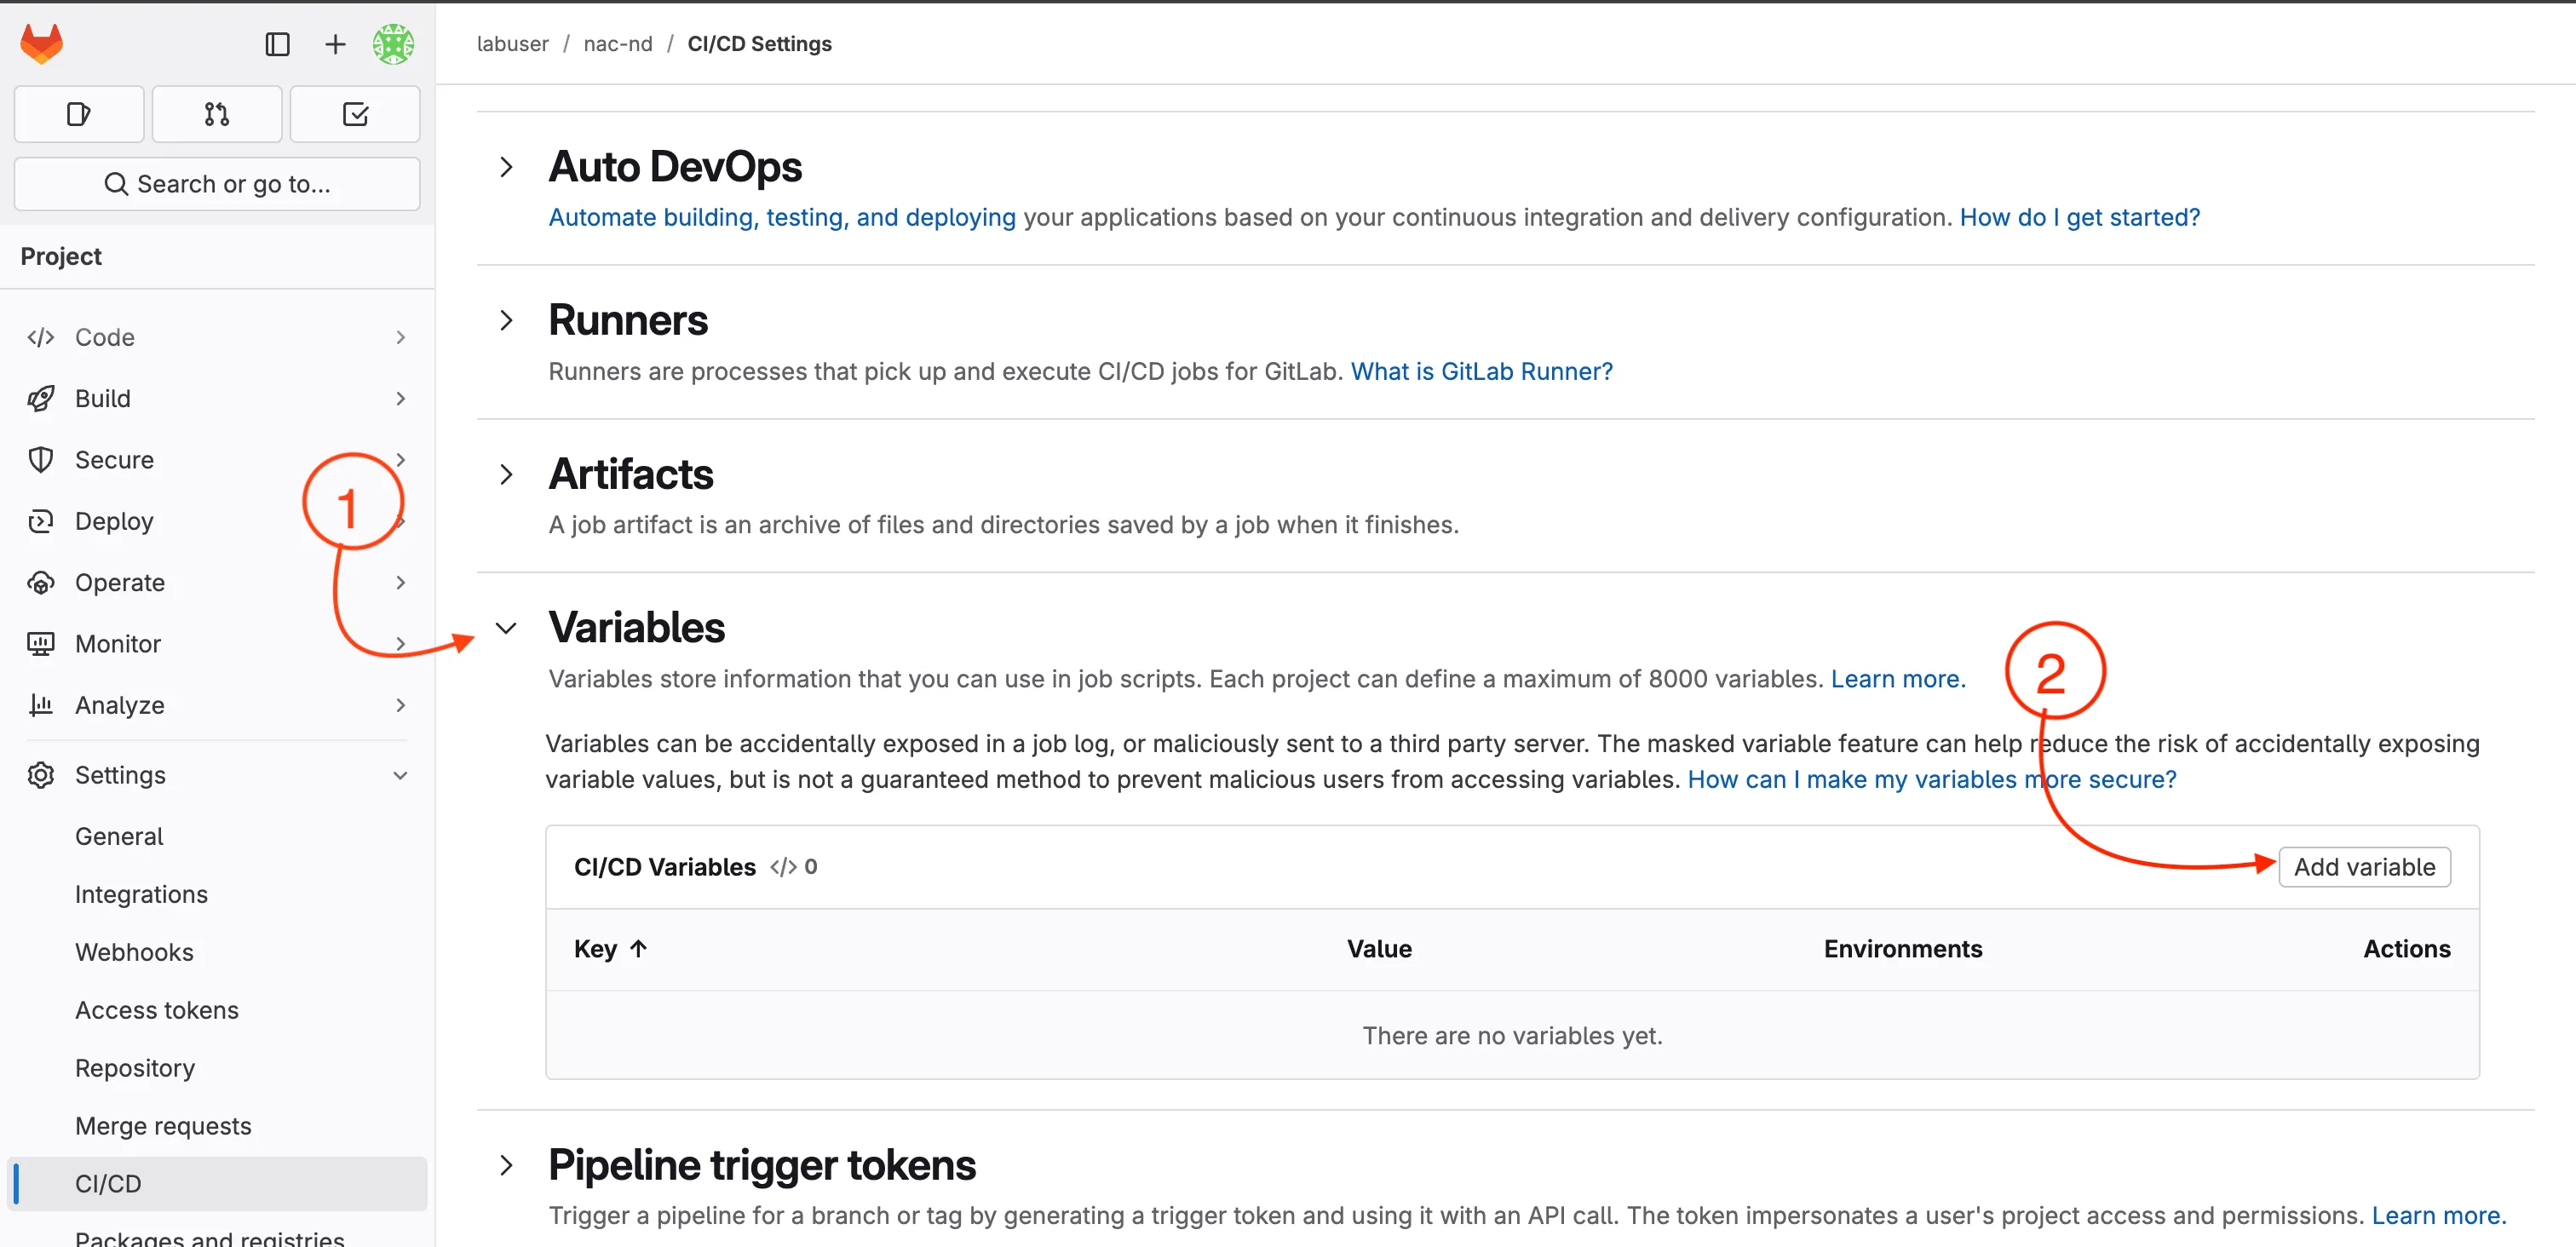
Expand the Variables section and click Add variable
Understanding protected and masked variables
Section titled “Understanding protected and masked variables”When working with variables inside of any CI/CD platform, the variables are often classified into categories. This is used to protect the variables from being exposed on execution. When working with a pipeline, the pipeline definition file contains the details of the execution.
The pipeline definition file specifies what is to execute based on branching. As an example, a operator might have permissions as a user of the source code manager ( GitLab ) to create a new branch and make changes to that branch. However, the operator may not have permissions to push changes into the primary or main branches. Those primary or main branches are what is known as protected branches.
By using protected branches, the operator can make changes to the code, but those changes will not be pushed into the main branch until they are approved by a senior operator or some other process is followed during a merge request or pull request. By protecting variables, the source code manager (SCM) doesn’t allow unprotected branches access to those credentials that are marked protected. Even if the automation would execute, it would fail since it has no way to connect to the devices or controllers.
Inside of GitLab, variables are set as:
Visibility Options
Section titled “Visibility Options”- Visible: Variables will be visible in job logs.
- Masked: Prevents the variable value from being displayed in job logs. Use this for sensitive data like passwords.
- Masked and hidden: Similar to Masked, but also hides the variable value in the UI.
- Protected: Restricts the variable to protected branches and tags. Use this for variables that should only be available in production or secure environments.
- Expand variable reference:
$is treated special for reference (usually always enabled).
Step 11: Add Required Variables
Section titled “Step 11: Add Required Variables”Enter the Key and Value for each variable (see table below).
| Key | Value | Visibility | Flags | Purpose |
|---|---|---|---|---|
ND_HOST | 198.18.133.100 | Visible | Expand | Cisco ND HOST |
ND_DOMAIN | local | Visible | Expand | Cisco ND Domain |
ND_USERNAME | admin | Visible | Expand | Cisco ND Username |
ND_PASSWORD | C1sco12345 | Masked | Expand | Cisco ND Password |
NDFC_SW_USERNAME | admin | Visible | Expand | Cisco NDFC Switch Username |
NDFC_SW_PASSWORD | C1sco12345 | Masked | Expand | Cisco NDFC Switch Password |
DC_VXLAN_SCHEMA | schema/schema.yaml | Visible | Expand | Schema file location |
Use the Add variable button for each entry, the variable section should look like below:
Note: You might be asking why we don’t have the variables marked as protected. The reason is because we haven’t configured the protected branch structure for this lab. In a production environment, you would typically have a protected branch (e.g.
main) where you would then set the password as protected. In some environments, they might want to also protect theND_HOSTandND_DOMAINvariables as well but that can make troubleshooting more difficult.
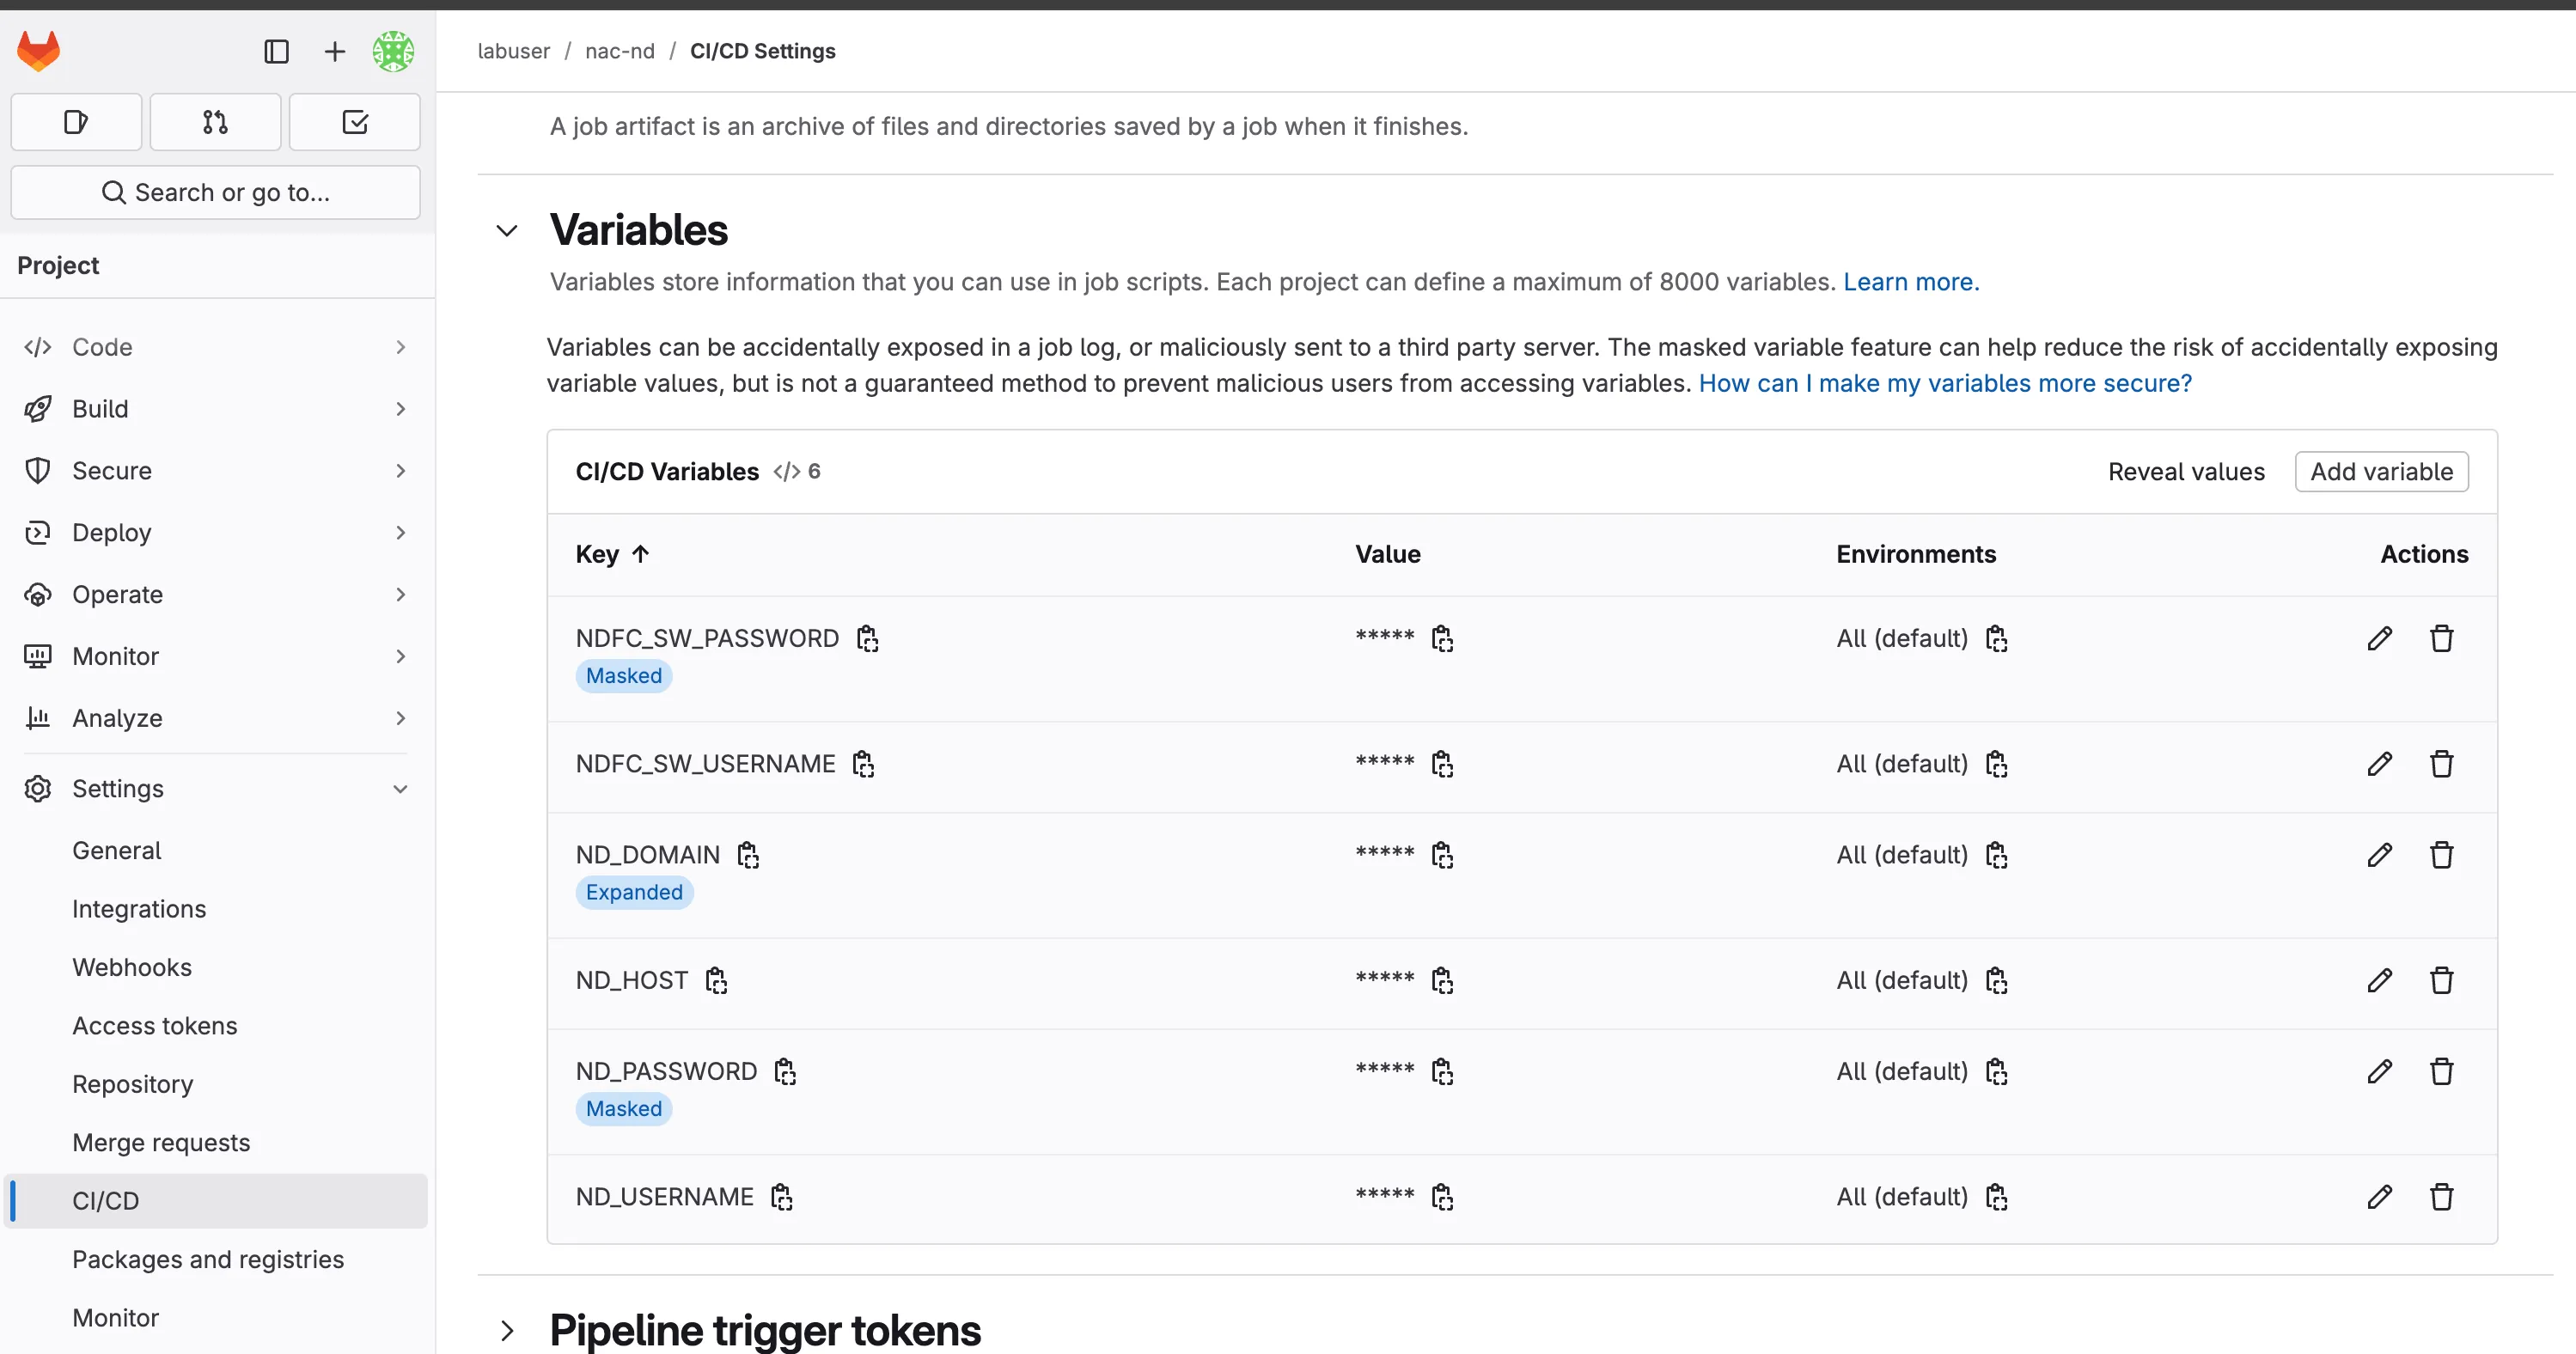
Variable Configuration Summary:
🔐 Authentication Variables:├── ND_HOST, ND_DOMAIN, ND_USERNAME, ND_PASSWORD (Nexus Dashboard access)├── NDFC_SW_USERNAME, NDFC_SW_PASSWORD (Switch credentials)
📁 Configuration Variables:├── DC_VXLAN_SCHEMA (Validation schema location)└── DC_VXLAN_RULES (Network rules location)
💡 Pro Tip: For production environments, consider using different variable values for different branches (development, staging, production) to maintain environment isolation.
Next Steps: Demonstrating Pipeline with Configuration Changes
Section titled “Next Steps: Demonstrating Pipeline with Configuration Changes”Now that your variables are configured, let’s demonstrate the pipeline’s power by making practical network configuration changes. We’ll uncomment VRF and network configurations that were previously commented out in the remove section, showcasing the complete Infrastructure as Code workflow.
This exercise demonstrates several key Infrastructure as Code principles by implementing declarative configuration where you define the desired state and let automation handle implementation, leveraging version control to track exactly what changes were made and when, ensuring automated validation to verify changes are valid before deployment, providing controlled deployment that applies changes only after validation and approval, and including comprehensive verification to confirm changes were applied correctly. This practical demonstration bridges the theoretical concepts with real-world network operations management.
Step 12: Prepare Configuration Changes
Section titled “Step 12: Prepare Configuration Changes”Based on your previous work in Understanding NaC ND Remove, you likely have VRF and network configurations that were commented out or removed. The workspace contains multiple VRFs (like NaC-VRF01, NaC-VRF02, NaC-VRF03, NaC-VRF04) and networks (like NaC-Net01, NaC-Net02, NaC-Net03, NaC-Net04) that may have been commented out during the remove exercises.
Let’s add back or uncomment some of these configurations through the pipeline to demonstrate the full workflow.
First, let’s examine what’s currently in your configuration files:
cd ~/network-as-code/nac-nd# Check current VRF configurationcat host_vars/nac-fabric1/vrfs.nac.yaml# Check current network configurationcat host_vars/nac-fabric1/networks.nac.yamlStep 13: Uncomment or Add Network Configuration
Section titled “Step 13: Uncomment or Add Network Configuration”Let’s uncomment or add back VRF and network configurations to demonstrate the pipeline workflow. You can choose to add any of the VRFs and networks that were previously commented out or removed:
Uncomment or add VRF configuration:
code-server host_vars/nac-fabric1/vrfs.nac.yamlFind the commented NaC-VRF04 VRF configurations and uncomment it, or add new ones. For example, you might add or uncomment configurations like NaC-VRF04:
- name: NaC-VRF04 vrf_id: 150004 vlan_id: 2004 vrf_attach_group: allUncomment or add network configuration:
code-server host_vars/nac-fabric1/networks.nac.yamlFind the commented NaC-Net04 network configurations and uncomment it, or add new ones. For example, you might add or uncomment configurations like NaC-Net04:
- name: NaC-Net04 vrf_name: NaC-VRF04 net_id: 130004 vlan_id: 2304 vlan_name: NaC-Net04_vlan2304 gw_ip_address: "192.168.12.4/24" network_attach_group: all💡 Tip: You can add back any combination of the VRFs and networks that were previously in your configuration. The examples above show NaC-VRF04 and NaC-Net04, but your actual workspace may have different or additional configurations like NaC-VRF01, NaC-VRF02, NaC-VRF03, and corresponding networks.
Step 14: Commit and Push Changes
Section titled “Step 14: Commit and Push Changes”The first command you will run is git status to check what files have changed since your last commit. This is a command that you will run often when working with GIT. It shows you which files have been modified, added, or deleted in your working directory and also notifies you of new files that are not yet tracked by GIT. If you where to create a new file, it would show up as an untracked file. This means you would first have to add the file with git add <filename> before you can add it in the repository.
git statusThe git diff command shows you the exact line-by-line changes you made to specific files. This is useful to review your changes before committing them. You can run git diff on the specific files you modified, such as the VRF and network configuration files.
git diff host_vars/nac-fabric1/vrfs.nac.yamlgit diff host_vars/nac-fabric1/networks.nac.yamlThe git commit command creates a new snapshot of your changes with a descriptive message explaining what changed and why. With the -a flag, it automatically stages all modified files for commit. The -m flag allows you to provide a commit message directly in the command. It is a good practice to write clear and concise commit messages that explain the purpose of the change. Bad commit messages can make it difficult to understand the history of your project and the reasons behind changes.
git commit -a -m "Add VRF and network config for NaC-VRF04 and NaC-Net04"Finally after you have done the commit, you will push your changes to the remote GitLab repository. This uploads your new commit to GitLab, which automatically triggers the CI/CD pipeline defined in your .gitlab-ci.yml file.
git push origin mainWhen prompted for credentials, use:
- Username:
labuser - Password:
C1sco12345
Understanding the Git Workflow:
git statusshows which files have been modified since your last commitgit diffdisplays the exact line-by-line changes you made to specific filesgit addstages specific files for commit (you can be selective about what to include)git commitcreates a new snapshot with a descriptive message explaining what changed and whygit pushuploads your new commit to GitLab, which automatically triggers the CI/CD pipeline
This workflow ensures every network change is documented, reviewable, and automatically processed through your validation and deployment pipeline.
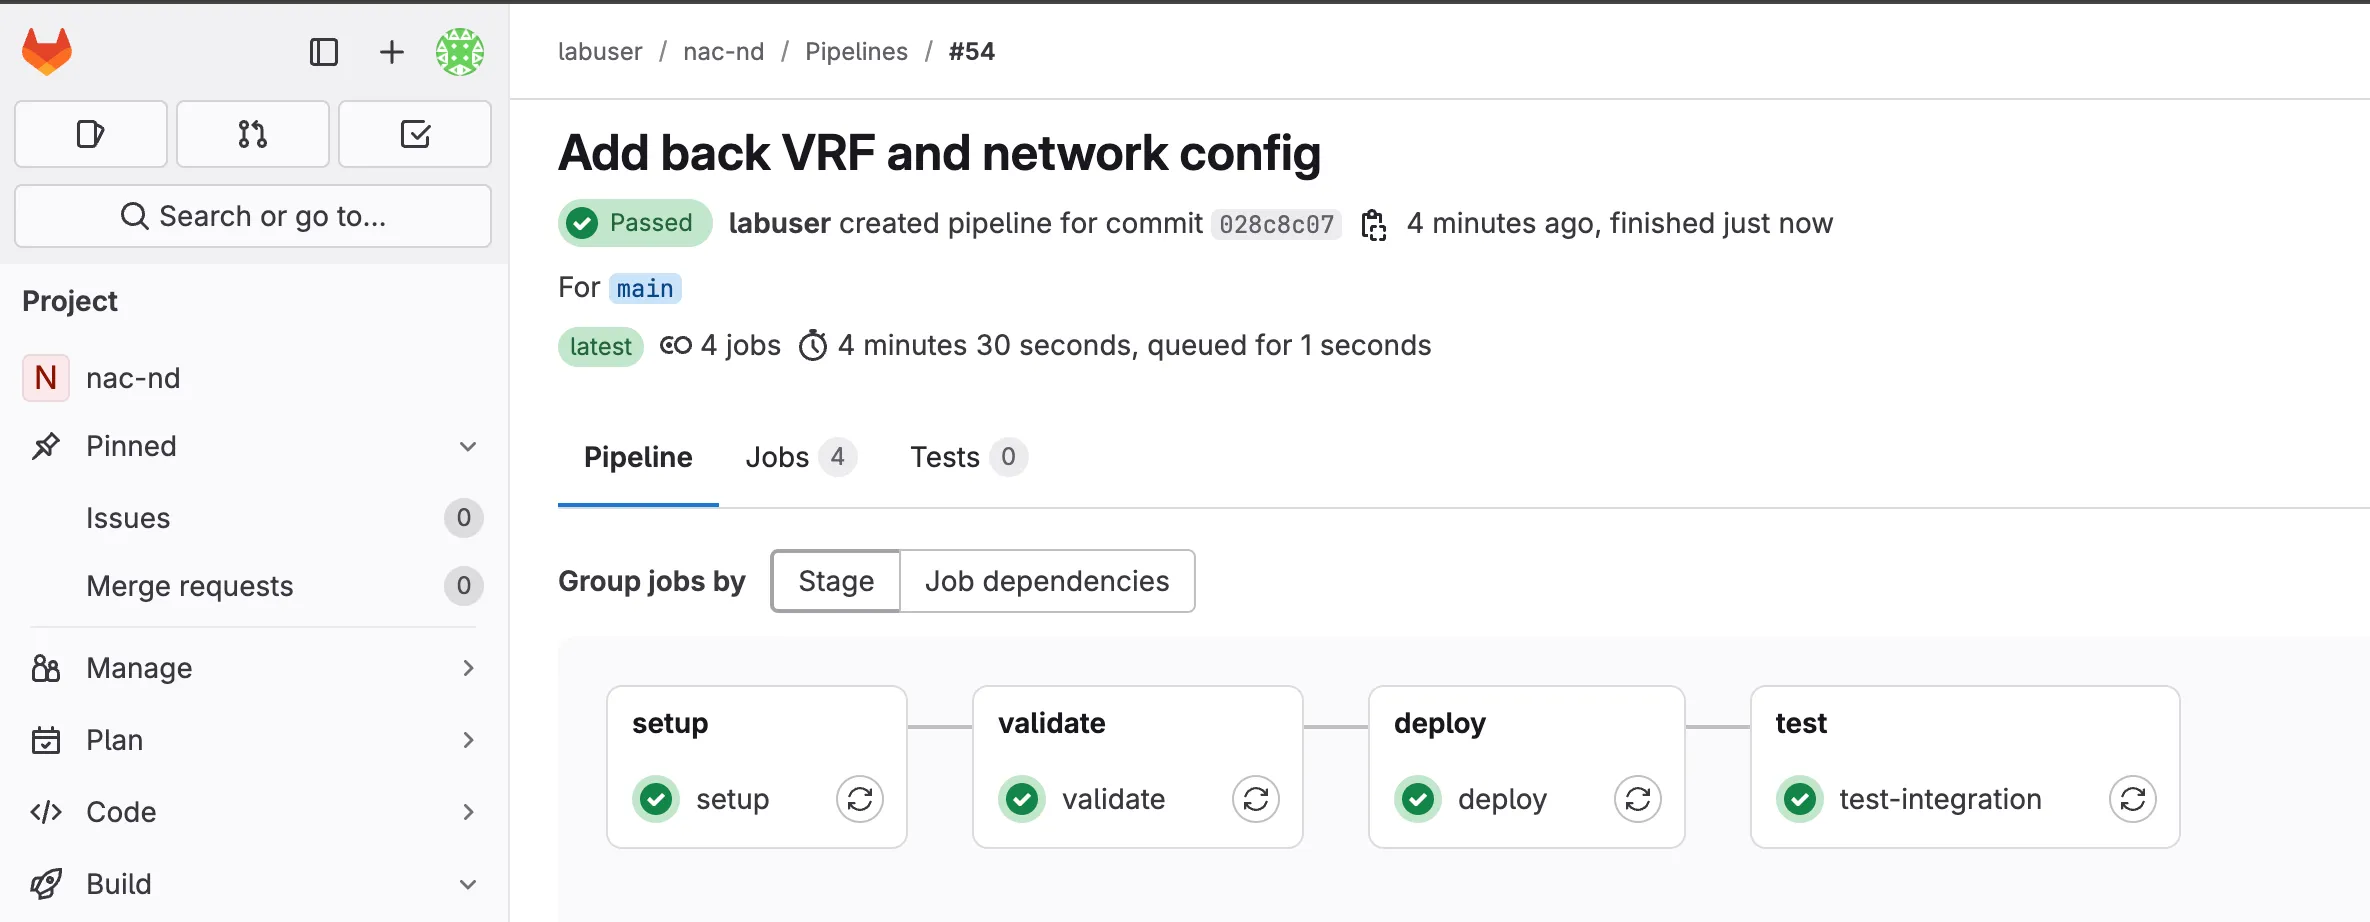
Step 15: Monitor Pipeline Execution
Section titled “Step 15: Monitor Pipeline Execution”Navigate to GitLab Pipelines:
- Go to your GitLab project
- Click Build > Pipelines
- You should see a new pipeline triggered by your push
Watch the Four-Stage Process:
⚙️ SETUP → 🔍 VALIDATE → 🚀 DEPLOY → 🧪 TEST
Monitor Pipeline Progress: Each stage will run according to the workflow described in Understanding Pipelines. Once the pipeline completes, you will see the status of each stage (success or failure).
Step 16: Verify in Nexus Dashboard
Section titled “Step 16: Verify in Nexus Dashboard”You can manually verify the changes in Nexus Dashboard to confirm the pipeline deployment was successful:
Access Nexus Dashboard
Section titled “Access Nexus Dashboard”| Component | Description | URL | Credential |
|---|---|---|---|
| Nexus Dashboard | Central management platform for the VXLAN/EVPN fabric. | Nexus Dashboard | Username: adminPassword: C1sco12345 |
Once you have logged in, you will switch into the Fabric view.
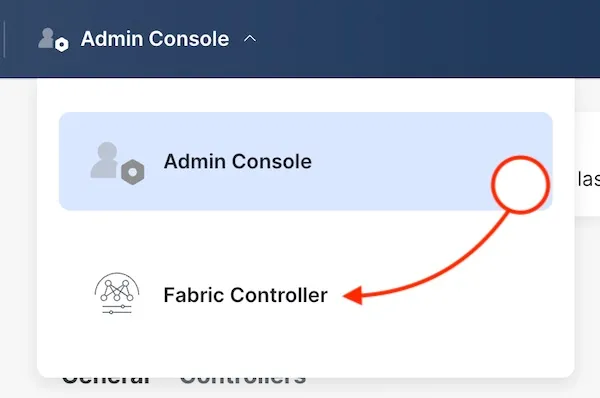
Fabric State
Section titled “Fabric State”To reach the fabric details, click on the fabrics on the manage menu.
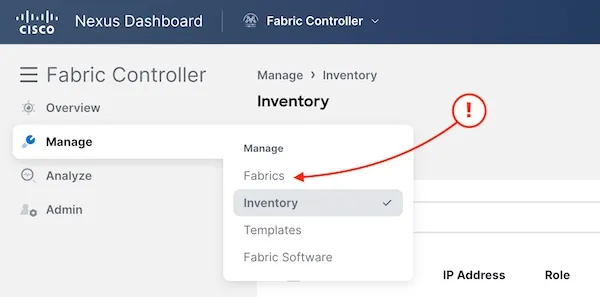
Then click on the fabric name and the link to fabric details.

Network Configuration Verification
Section titled “Network Configuration Verification”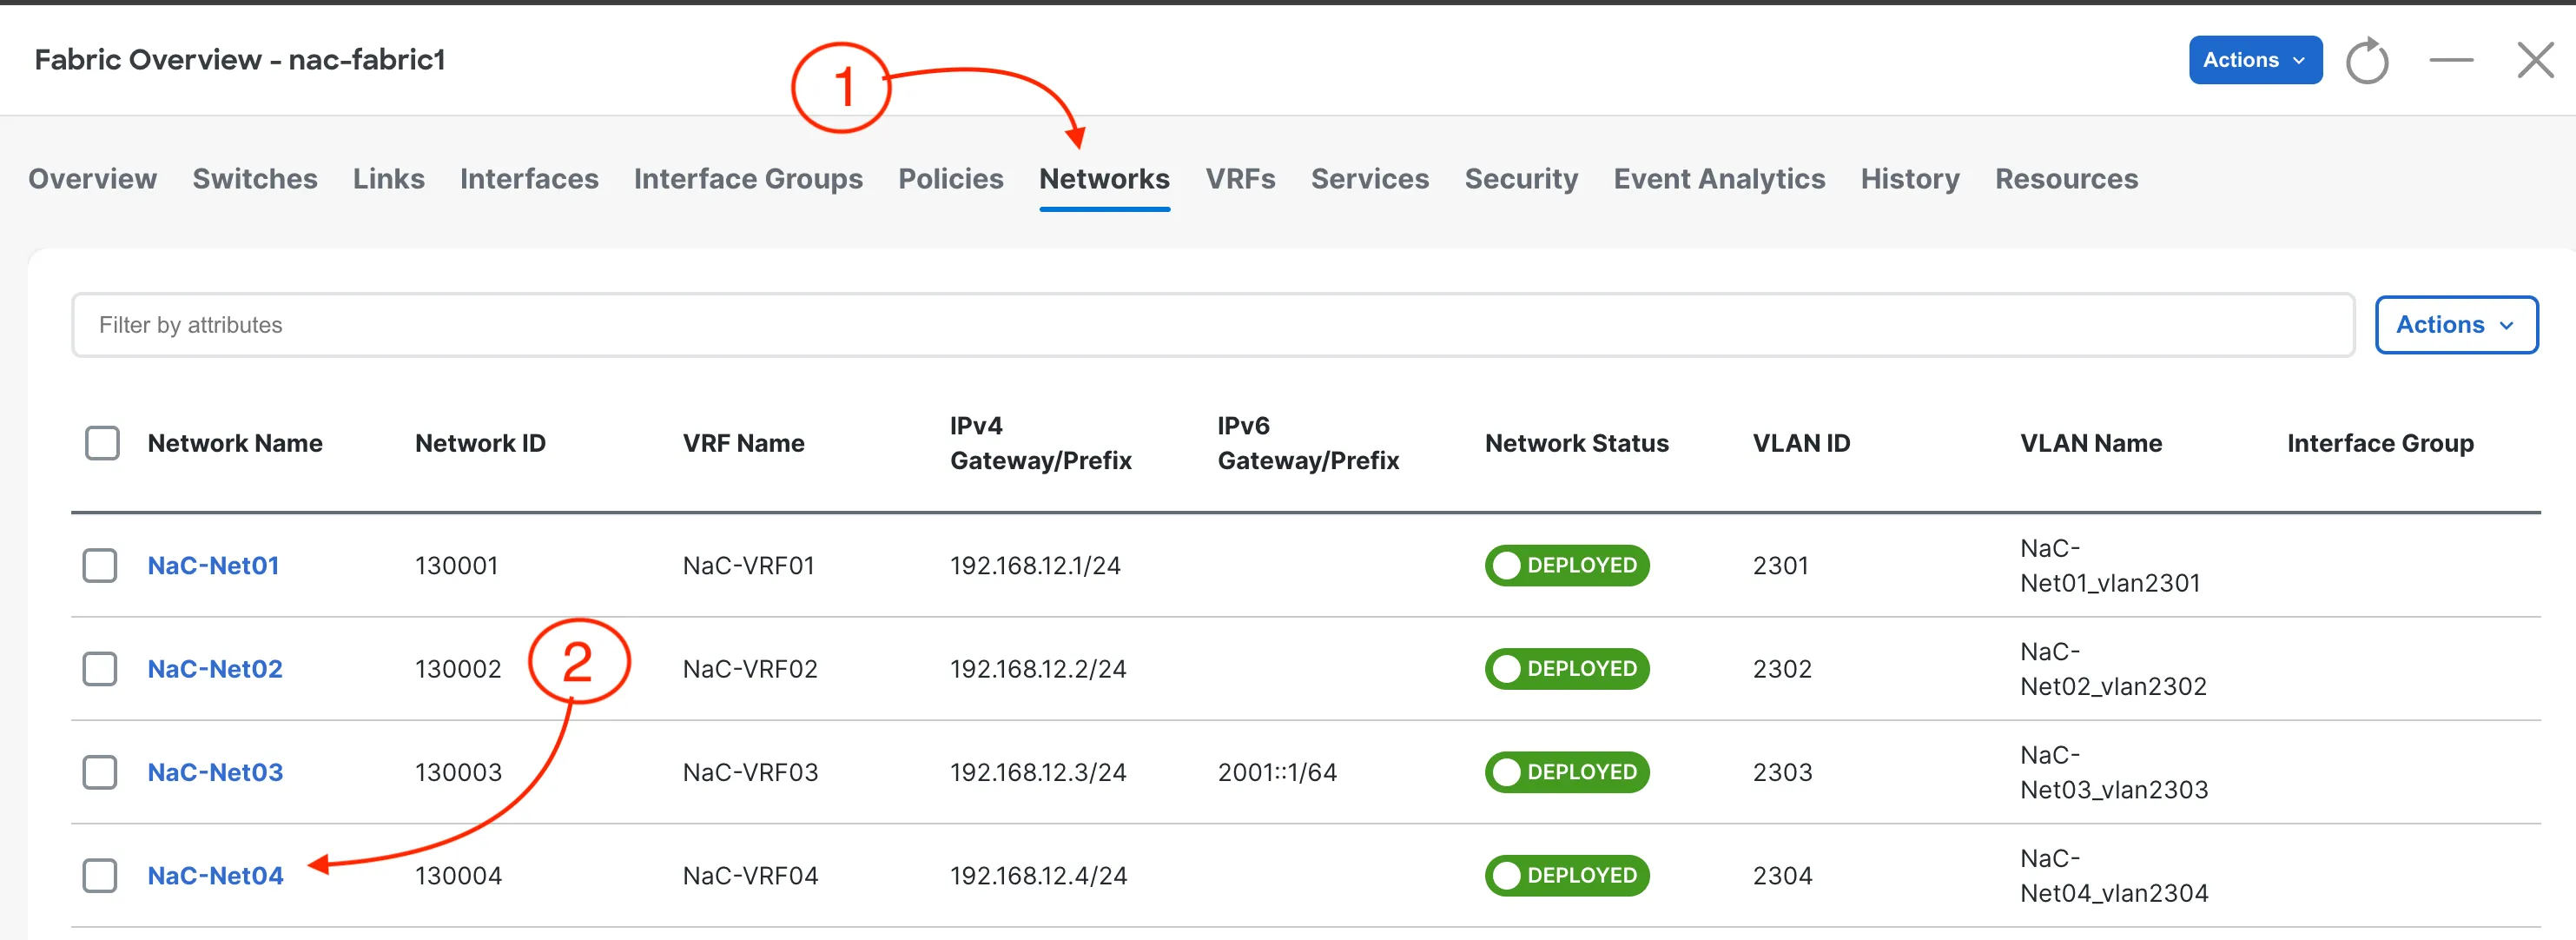
Click on the Networks tab to see the networks that have been deployed by Network as Code Nexus Dashboard through your pipeline.
You can verify that the networks you added (such as NaC-Net04) appear in the network list with the correct VRF associations and configurations.
VRF Configuration Verification
Section titled “VRF Configuration Verification”Click on the VRFs tab to see the VRFs that have been deployed by Network as Code Nexus Dashboard through your pipeline.
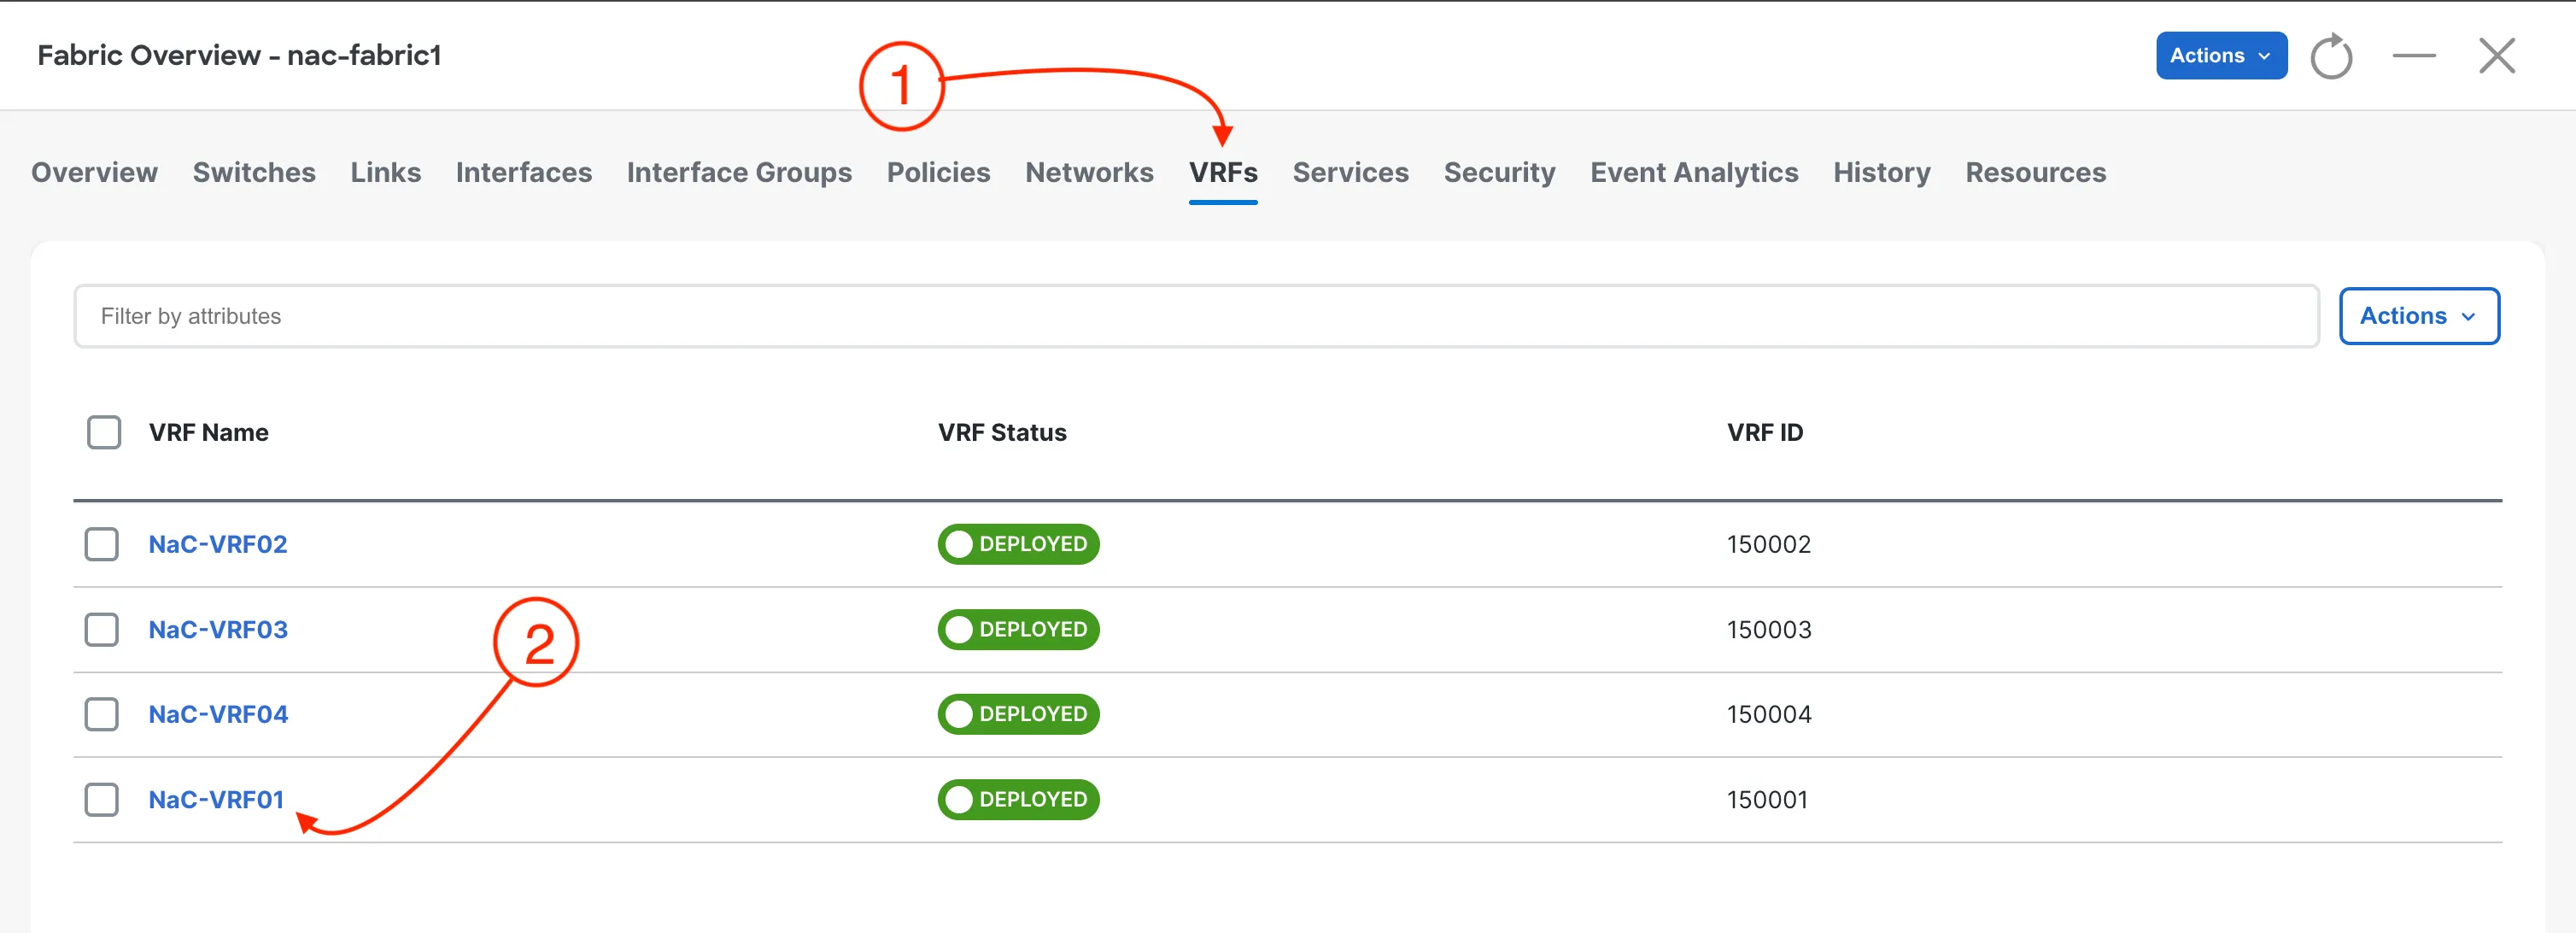
You can verify that the VRFs you added (such as NaC-VRF04) appear in the VRF list with the correct VLAN IDs and attach group configurations. This confirms that your pipeline successfully deployed the infrastructure changes to the network fabric.
For details on the pipeline stages and how the CI/CD process works, see Understanding Pipelines.
Step 17: Review Pipeline Test Results
Section titled “Step 17: Review Pipeline Test Results”The final stage of your CI/CD pipeline uses Robot Framework with the NaC-Test tool to verify that your deployed configuration matches the intended network state. This automated testing provides confidence that your Infrastructure as Code deployment was successful.
A network operator can view the results in two separate ways: through the GitLab pipeline interface or by downloading the test artifacts directly. nac-test provides two outputs during execution: a detailed HTML report and a JUnit-compatible XML file for integration with GitLab. The XML JUnit file is used to display the test results in the GitLab pipeline interface, that is visible if you click on the Tests tab in the pipeline details.
For the HTML report, you can download the test artifacts from the pipeline job details. This provides a comprehensive overview of the test execution, including pass/fail status, execution timeline, and detailed logs for each test case.
Navigating to Test Results in GitLab
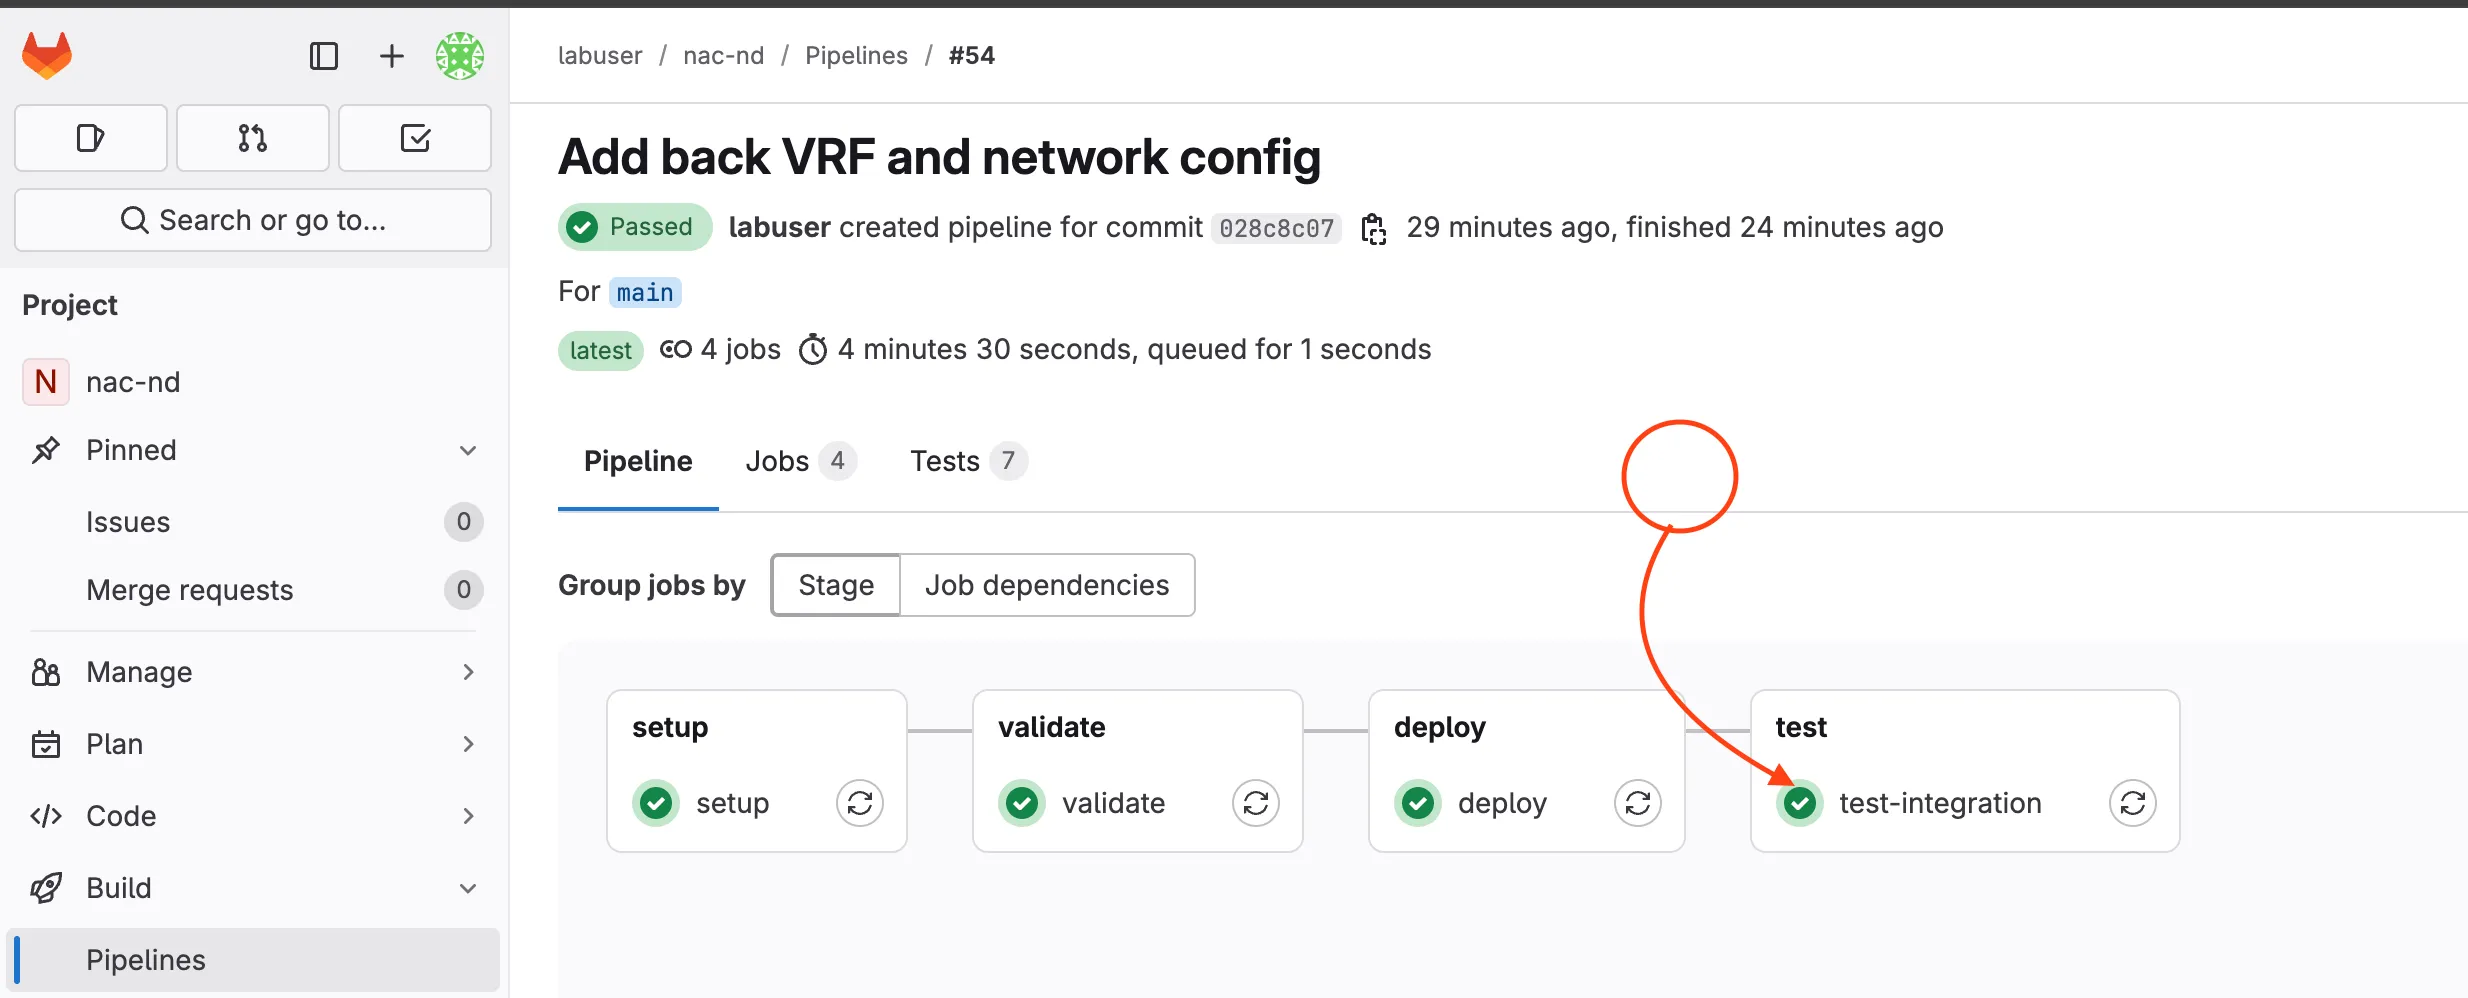
Section titled “Navigating to Test Results in GitLab”- Go to your GitLab project
- Click on Build > Pipelines in the left navigation menu
- Select the completed pipeline you want to review (click on the pipeline status or commit message)
- Click on the test-integration job in the test stage (the rightmost stage in your pipeline visualization)
Downloading and Reviewing Test Artifacts
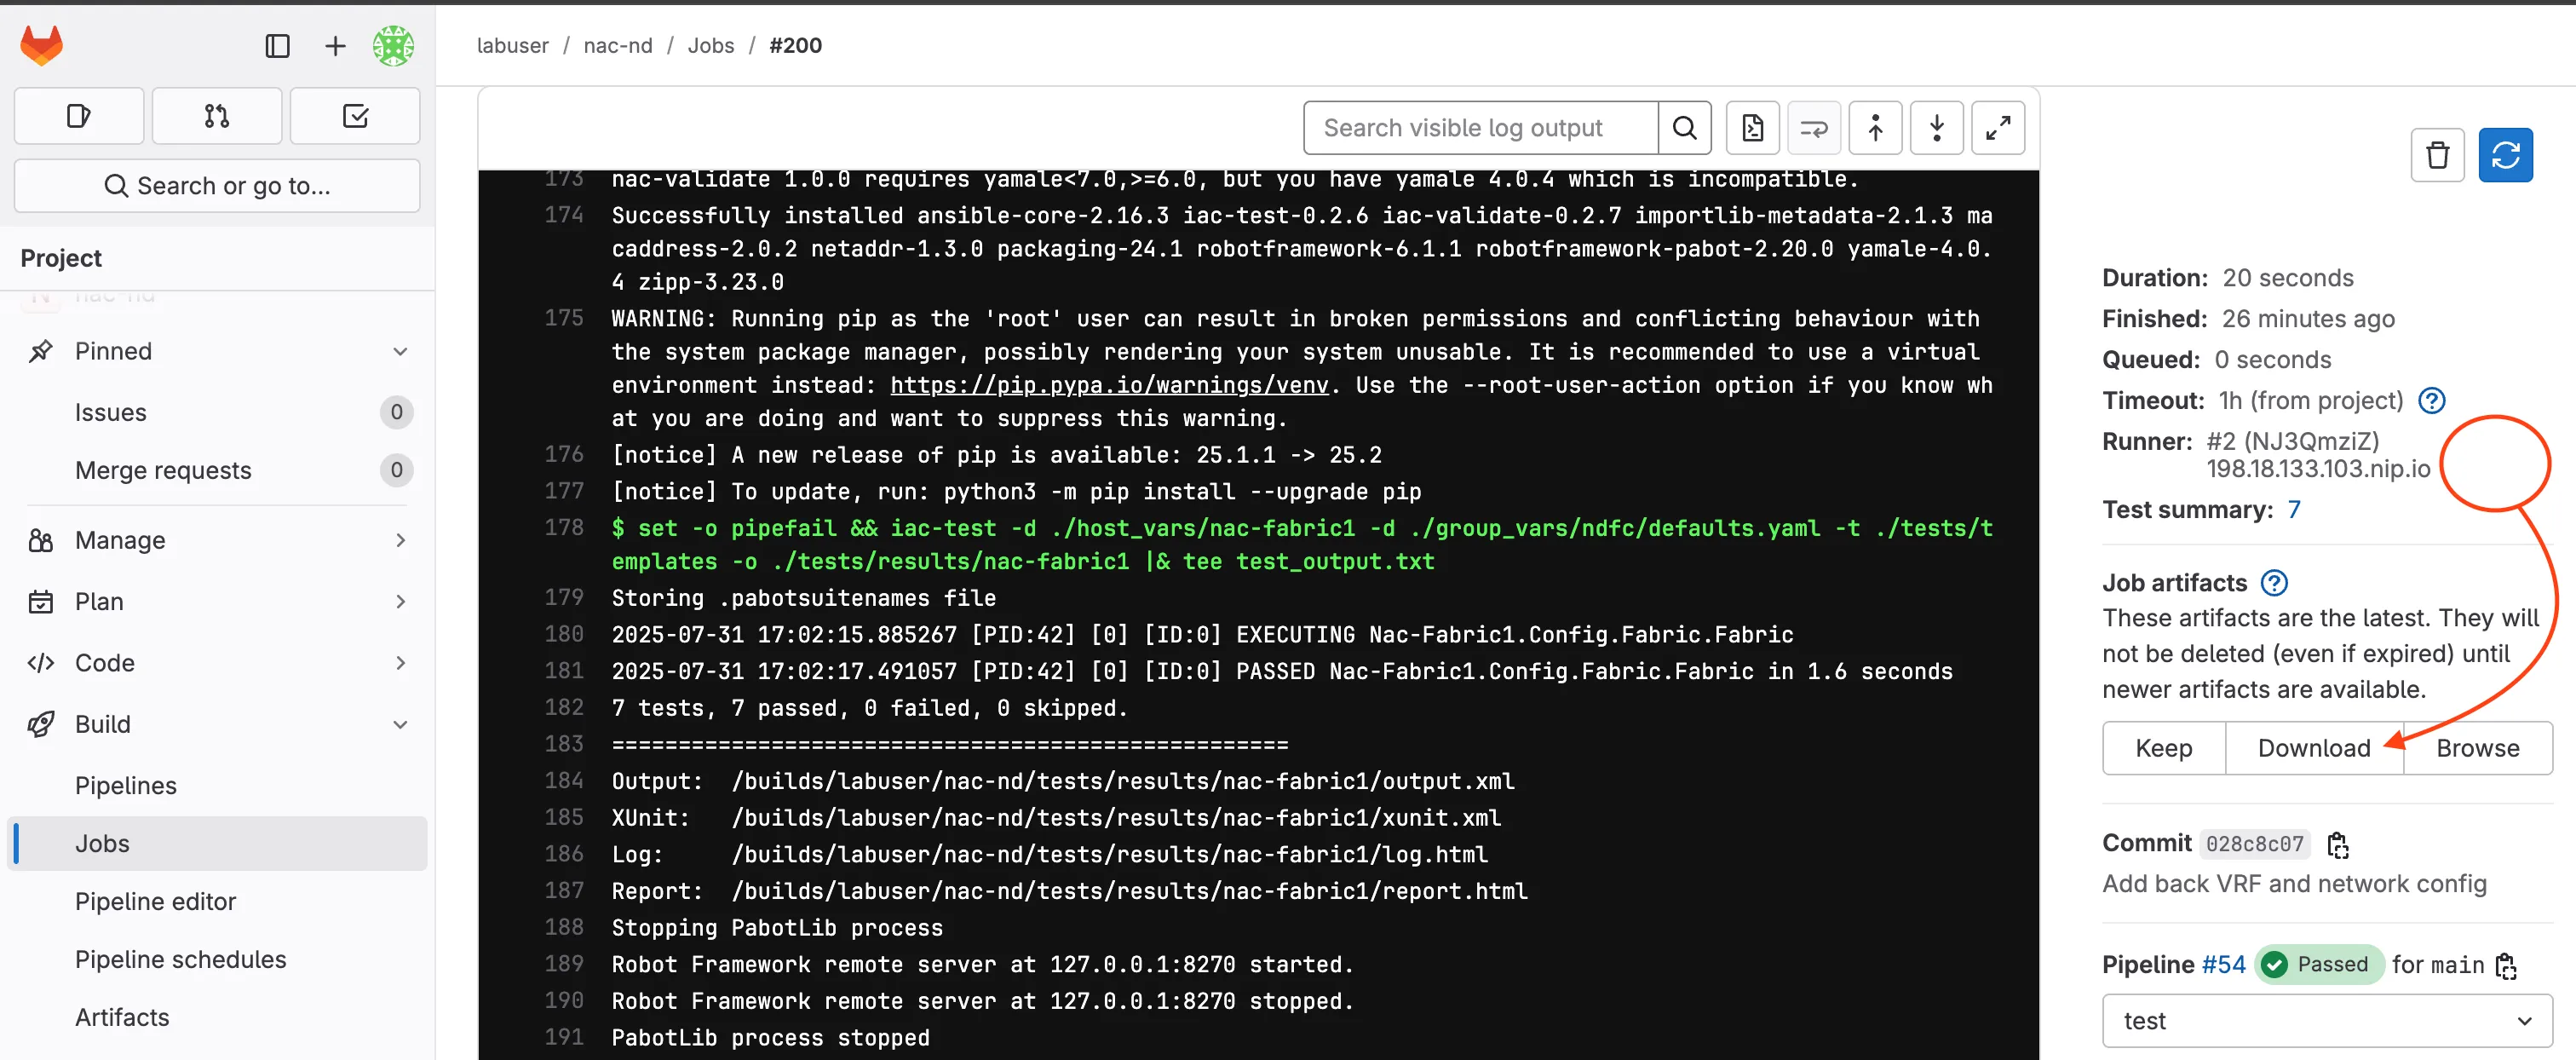
Section titled “Downloading and Reviewing Test Artifacts”- In the test-integration job details, scroll down to find the Job artifacts section on the right side
- Click the Download button to get the test results archive (it will download a zip file)
- Extract the downloaded zip file to your local machine to review the results
Understanding Test Report Files
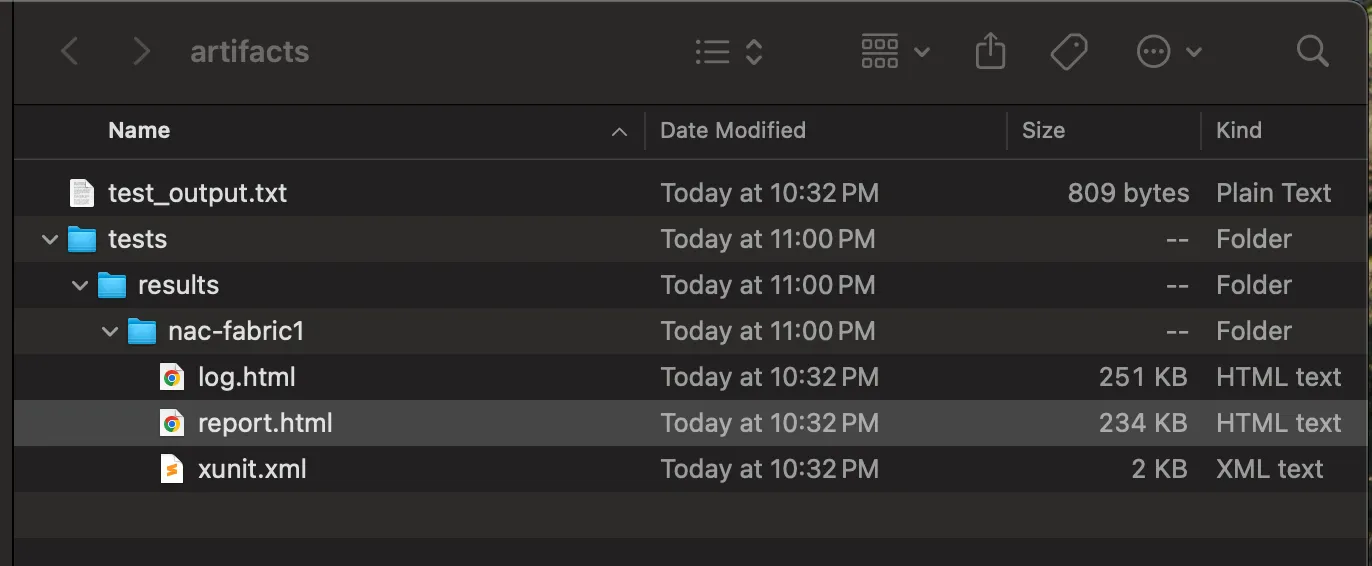
Section titled “Understanding Test Report Files”- Open the extracted folder and look for these key files:
tests/results/nac-fabric1/report.html- Main test execution report with summary and pass/fail statustests/results/nac-fabric1/log.html- Detailed test execution log with step-by-step informationtests/results/nac-fabric1/xunit.xml- JUnit-compatible test results for GitLab integrationtest_output.txt- Console output from the test execution
- Open
report.htmlin your web browser to review:- Overall test suite summary (passed/failed tests)
- Individual test case results
- Execution timeline and statistics
- Links to detailed logs for failed tests
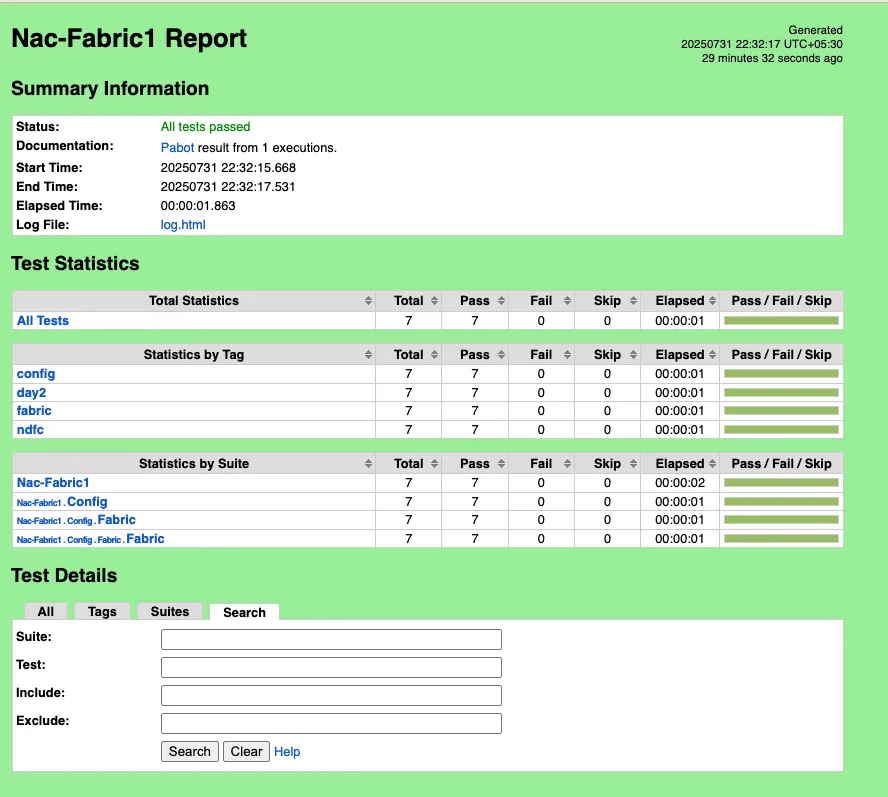
This report provides a comprehensive overview of how your deployed configuration performed against the expected state defined in your test templates.