Task 11 - Automation Pipelines with Meraki as Code
This guide demonstrates how to implement a working CI/CD pipeline for your Meraki as Code project using GitLab. Building on the concepts from Understanding Pipelines, we’ll transform your existing workspace into a production-ready, version-controlled project with automated validation, deployment, and testing capabilities.
Why Implement CI/CD for Network Operations?
Section titled “Why Implement CI/CD for Network Operations?”In the previous section, you learned about the theoretical benefits of automation pipelines for network operations. Now we’ll put those concepts into practice. By the end of this section, you’ll have:
- Automated Validation: Every configuration change will be automatically validated against schema and business rules
- Controlled Deployment: Changes will only deploy after passing all validation checks and manual approval
- Comprehensive Testing: Post-deployment testing will verify that your intended configuration matches the actual network state
- Complete Auditability: Every change, test result, and deployment will be tracked and documented
This practical implementation bridges the gap between traditional network change management and modern Infrastructure as Code practices.
Starting Point: Your Workspace
Section titled “Starting Point: Your Workspace”In the Code Server environment, you already have your working Meraki as Code configuration. The next step is to prepare it for version control and CI/CD.
If you’re following along using the dCloud lab, a GitLab instance is already provided. Otherwise, you can use your own GitLab—or any other CI/CD platform—though you will need to adjust the provided CI/CD configuration accordingly.
Understanding the Pipeline Integration
Section titled “Understanding the Pipeline Integration”Your workspace already contains a .gitlab-ci.yml file that implements the multi-stage pipeline discussed in the Understanding Pipelines section:
- Prepare: Renders templates and variables from the
data/folder into a singlemerged_configuration.nac.yamlused by later validation and test stages. - Validate: Checks Terraform formatting and runs
nac-validateagainst the data model schema and custom rules to catch configuration errors before any infrastructure changes. - Plan: Runs
terraform planto calculate the exact set of resources that will be created, modified, or destroyed — giving operators a chance to review before deployment. - Deploy: Executes
terraform applyto push the planned configuration to the Meraki Dashboard. This stage runs only on themainbranch. - Test Integration: Runs
nac-testto compare the live Meraki Dashboard state against the intended configuration, verifying that the deployment matches the declared data model. - Test Idempotency: Runs
terraform plana second time after deployment. If no changes are detected, the configuration is confirmed to be stable and fully converged. Any drift here indicates an issue that needs investigation. - Notify: Sends pipeline success or failure notifications to a Webex Teams space, keeping the team informed without needing to monitor GitLab directly.
Creating a GitLab Project and Preparing Your Workspace
Section titled “Creating a GitLab Project and Preparing Your Workspace”Understanding Git and GitLab in Network Operations Context
Section titled “Understanding Git and GitLab in Network Operations Context”Before diving into the setup, it’s important to understand why we’re using Git and GitLab for network configuration management:
Git provides version control - the ability to track every change to your network configuration over time. This means you can:
- See exactly what changed between any two versions of your network state
- Rollback to previous configurations if needed
- Collaborate with team members without conflicts
- Maintain a complete audit trail of all network changes
GitLab provides the CI/CD platform that automates our pipeline processes:
- Automatically validates configuration changes before they’re applied
- Provides controlled deployment workflows with approval gates
- Runs comprehensive testing after deployments
- Maintains artifacts and reports for compliance and troubleshooting
This combination transforms network operations from manual, error-prone processes to automated, reliable workflows.
Step 1: Login to GitLab instance
Section titled “Step 1: Login to GitLab instance”Before you can use version control and create CI/CD pipelines, you need a remote repository to store your code and manage collaboration. So we are going to create a GitLab project. This provides:
- A central place to store and back up your code
- Collaboration features for teams
- Integration with GitLab CI/CD to automate configuration validation, deployment, and testing
- Visibility and history of all changes made to your project
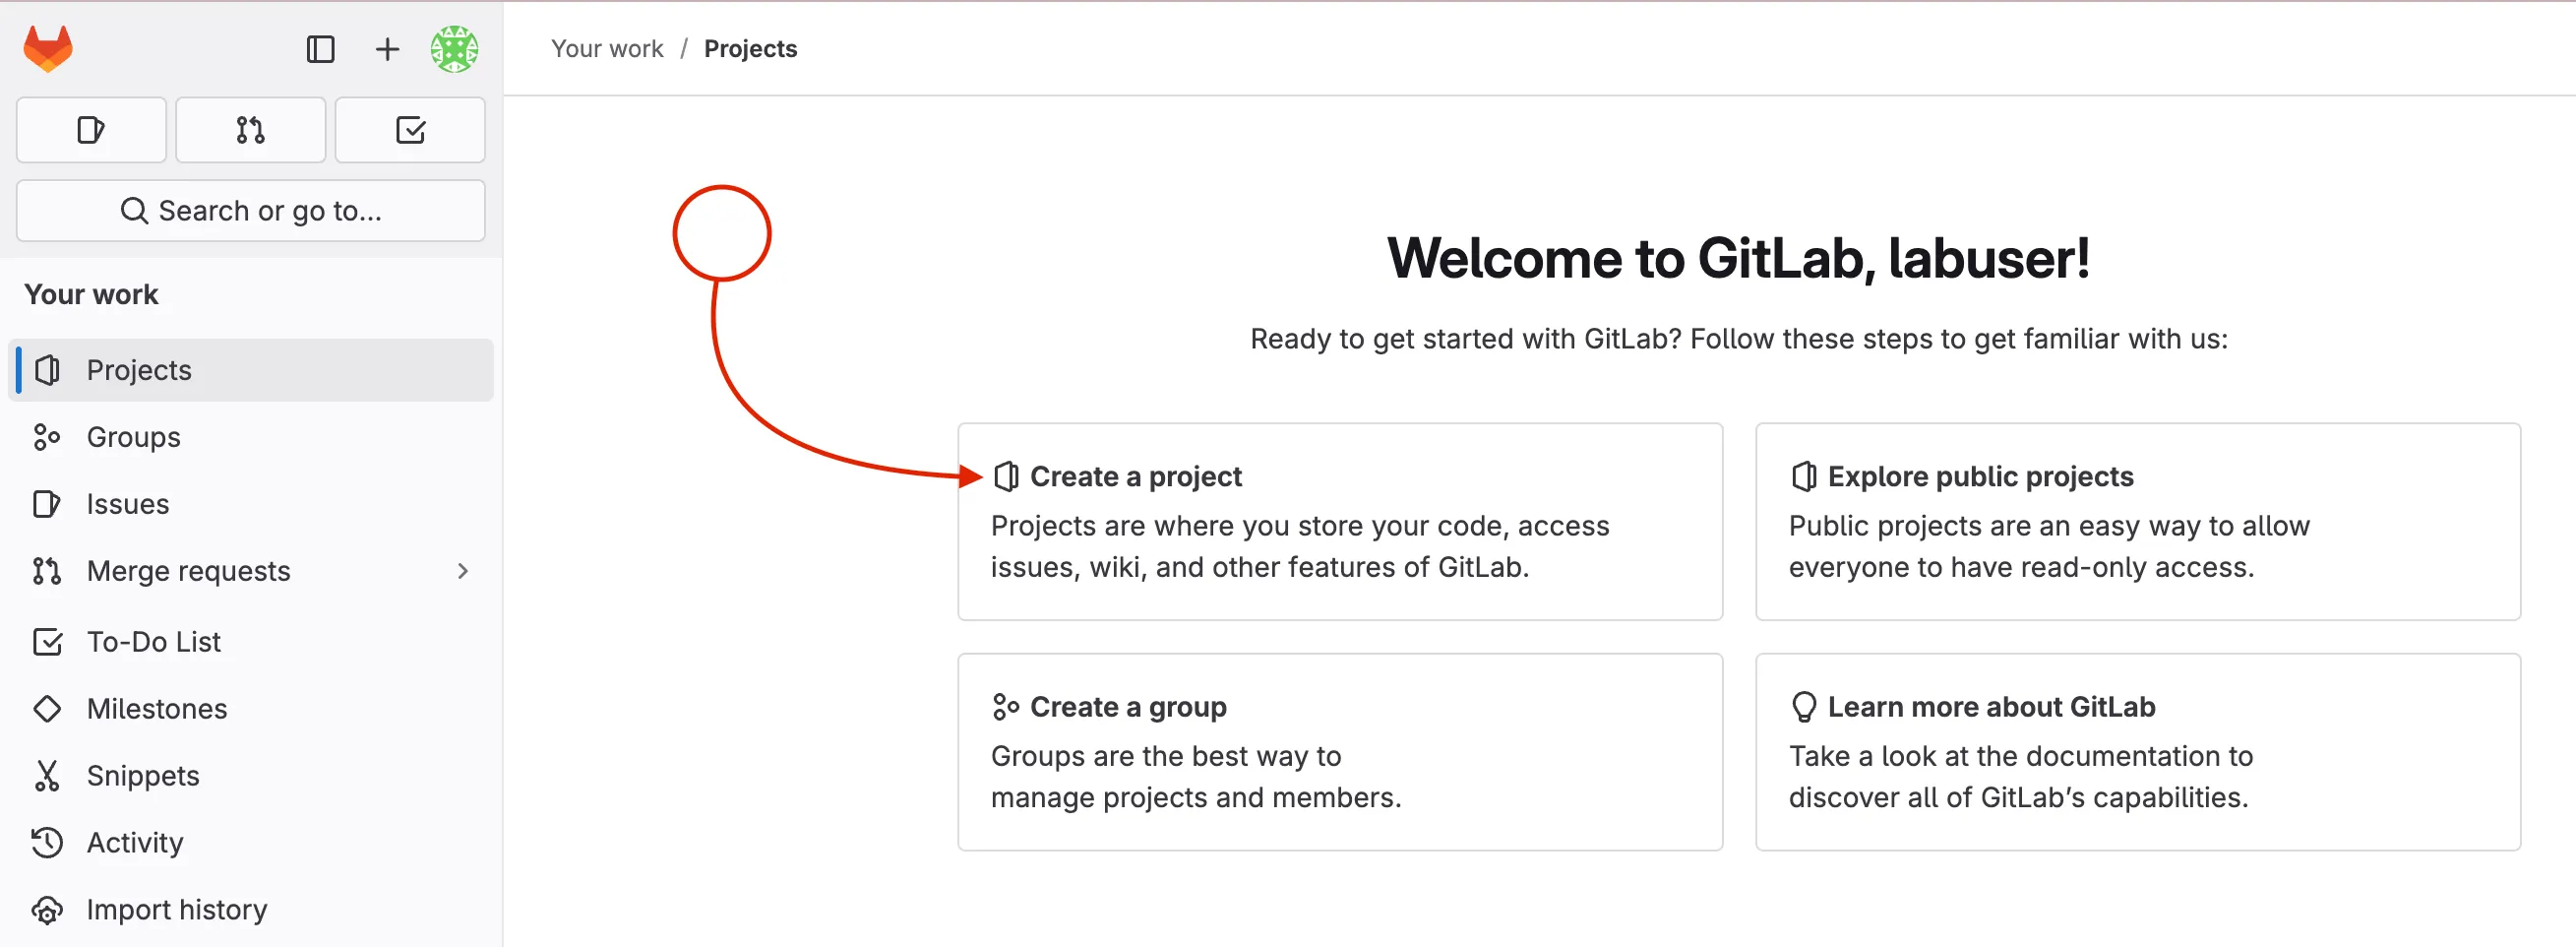
Step 2: Create a new GitLab project
Section titled “Step 2: Create a new GitLab project”After you have logged into GitLab you will create a new project.
- Click Create a project to start a new project
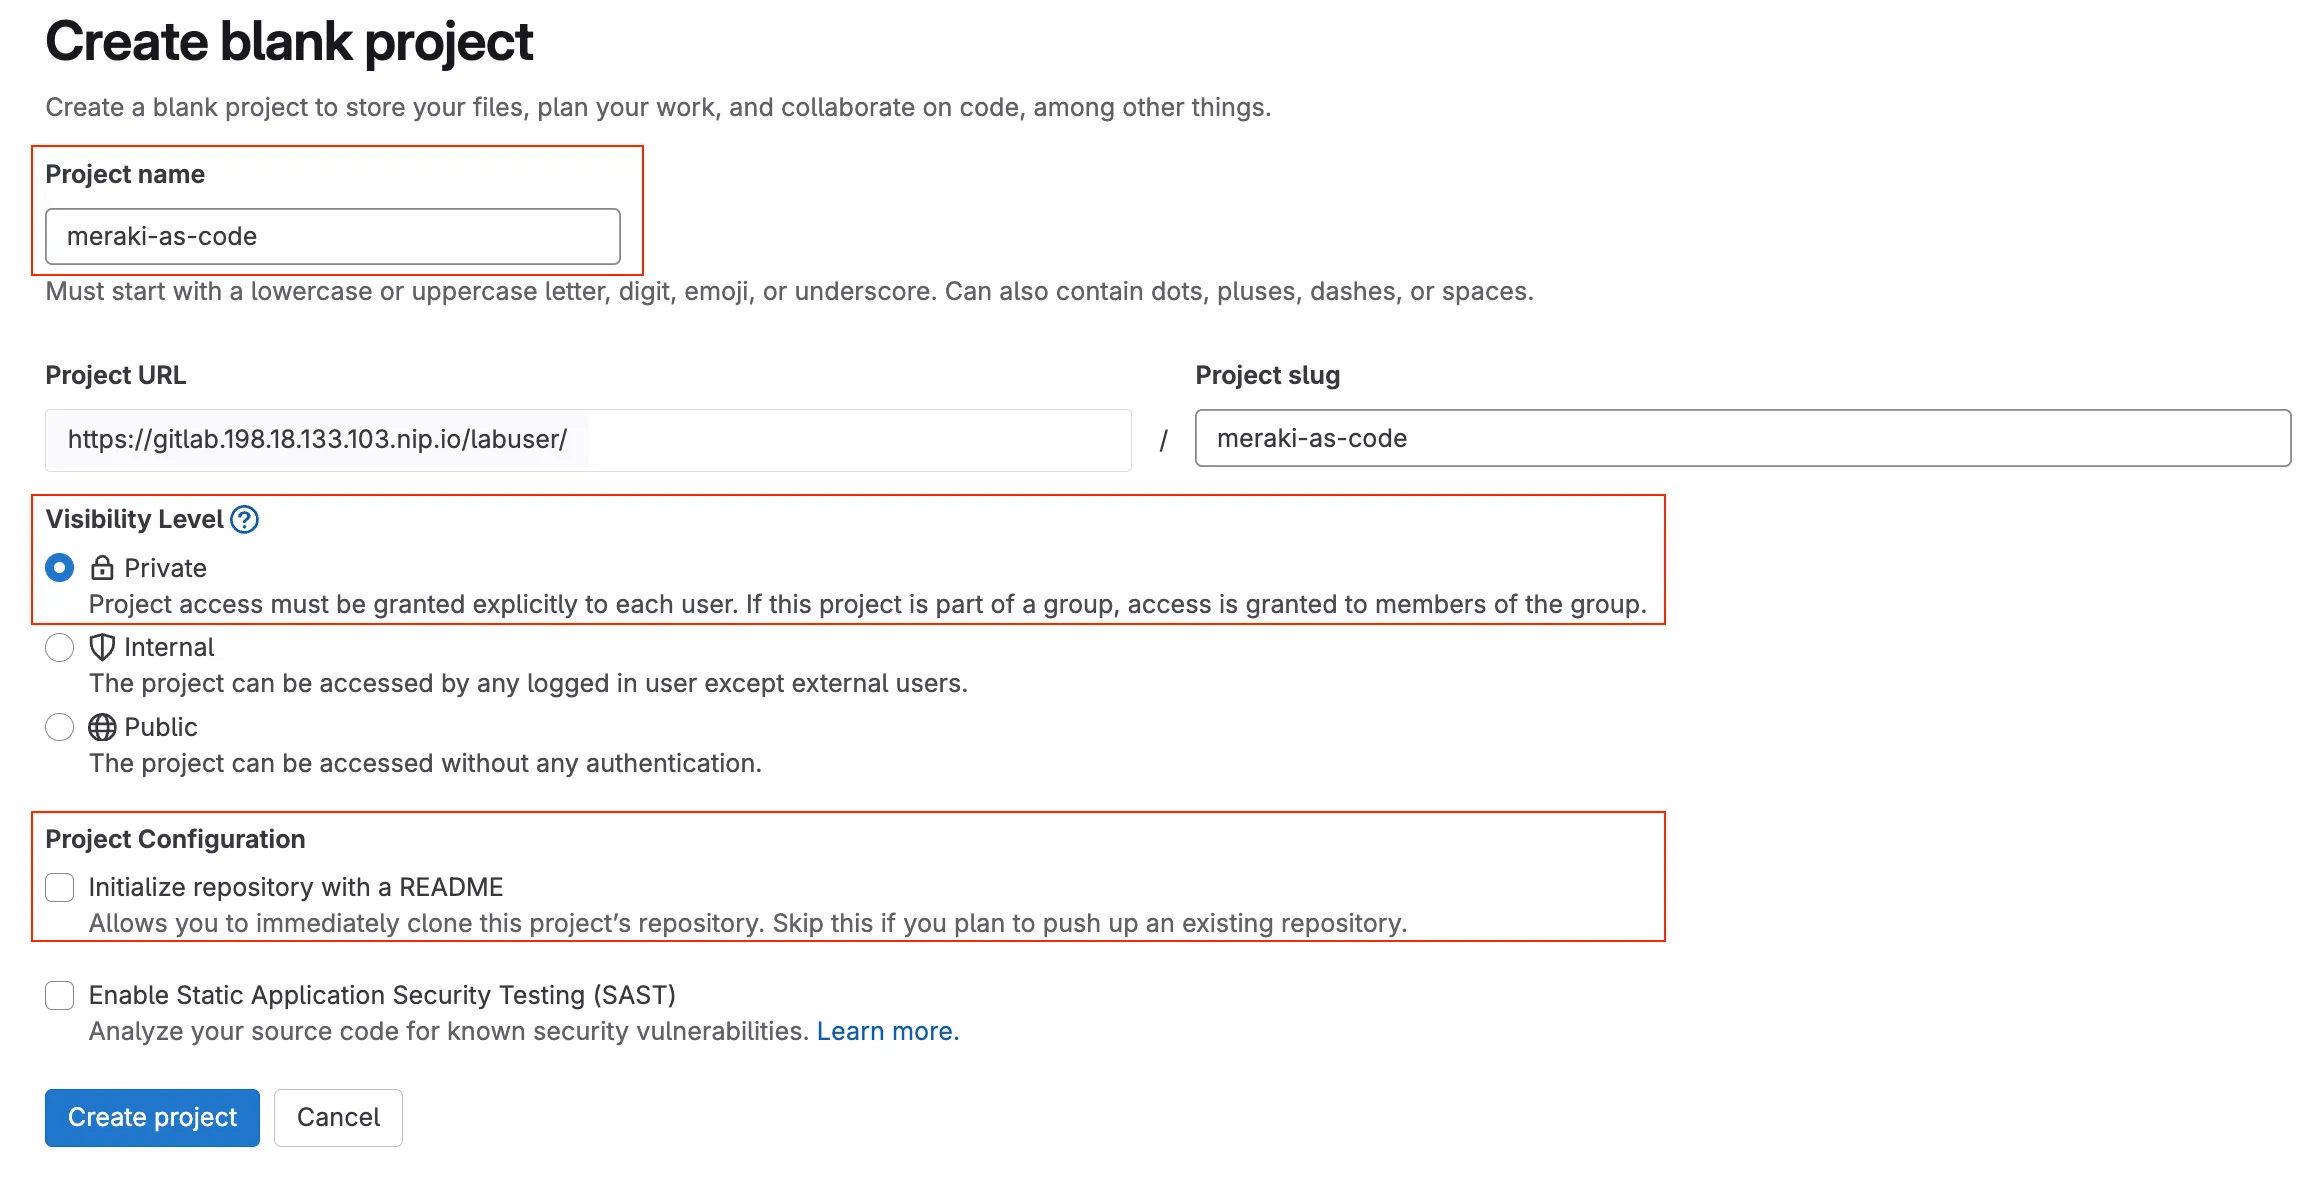
Choose Create blank project to start with an empty repository. This is ideal for our use case where we will push existing code from the code server.
Enter the project name (e.g.,
meraki-as-code)Set visibility to Private (to restrict access to your project to only you and authorized users)
Uncheck the Initialize repository with a README option (since you will push your existing code)
Click Create project to finalize the project creation.
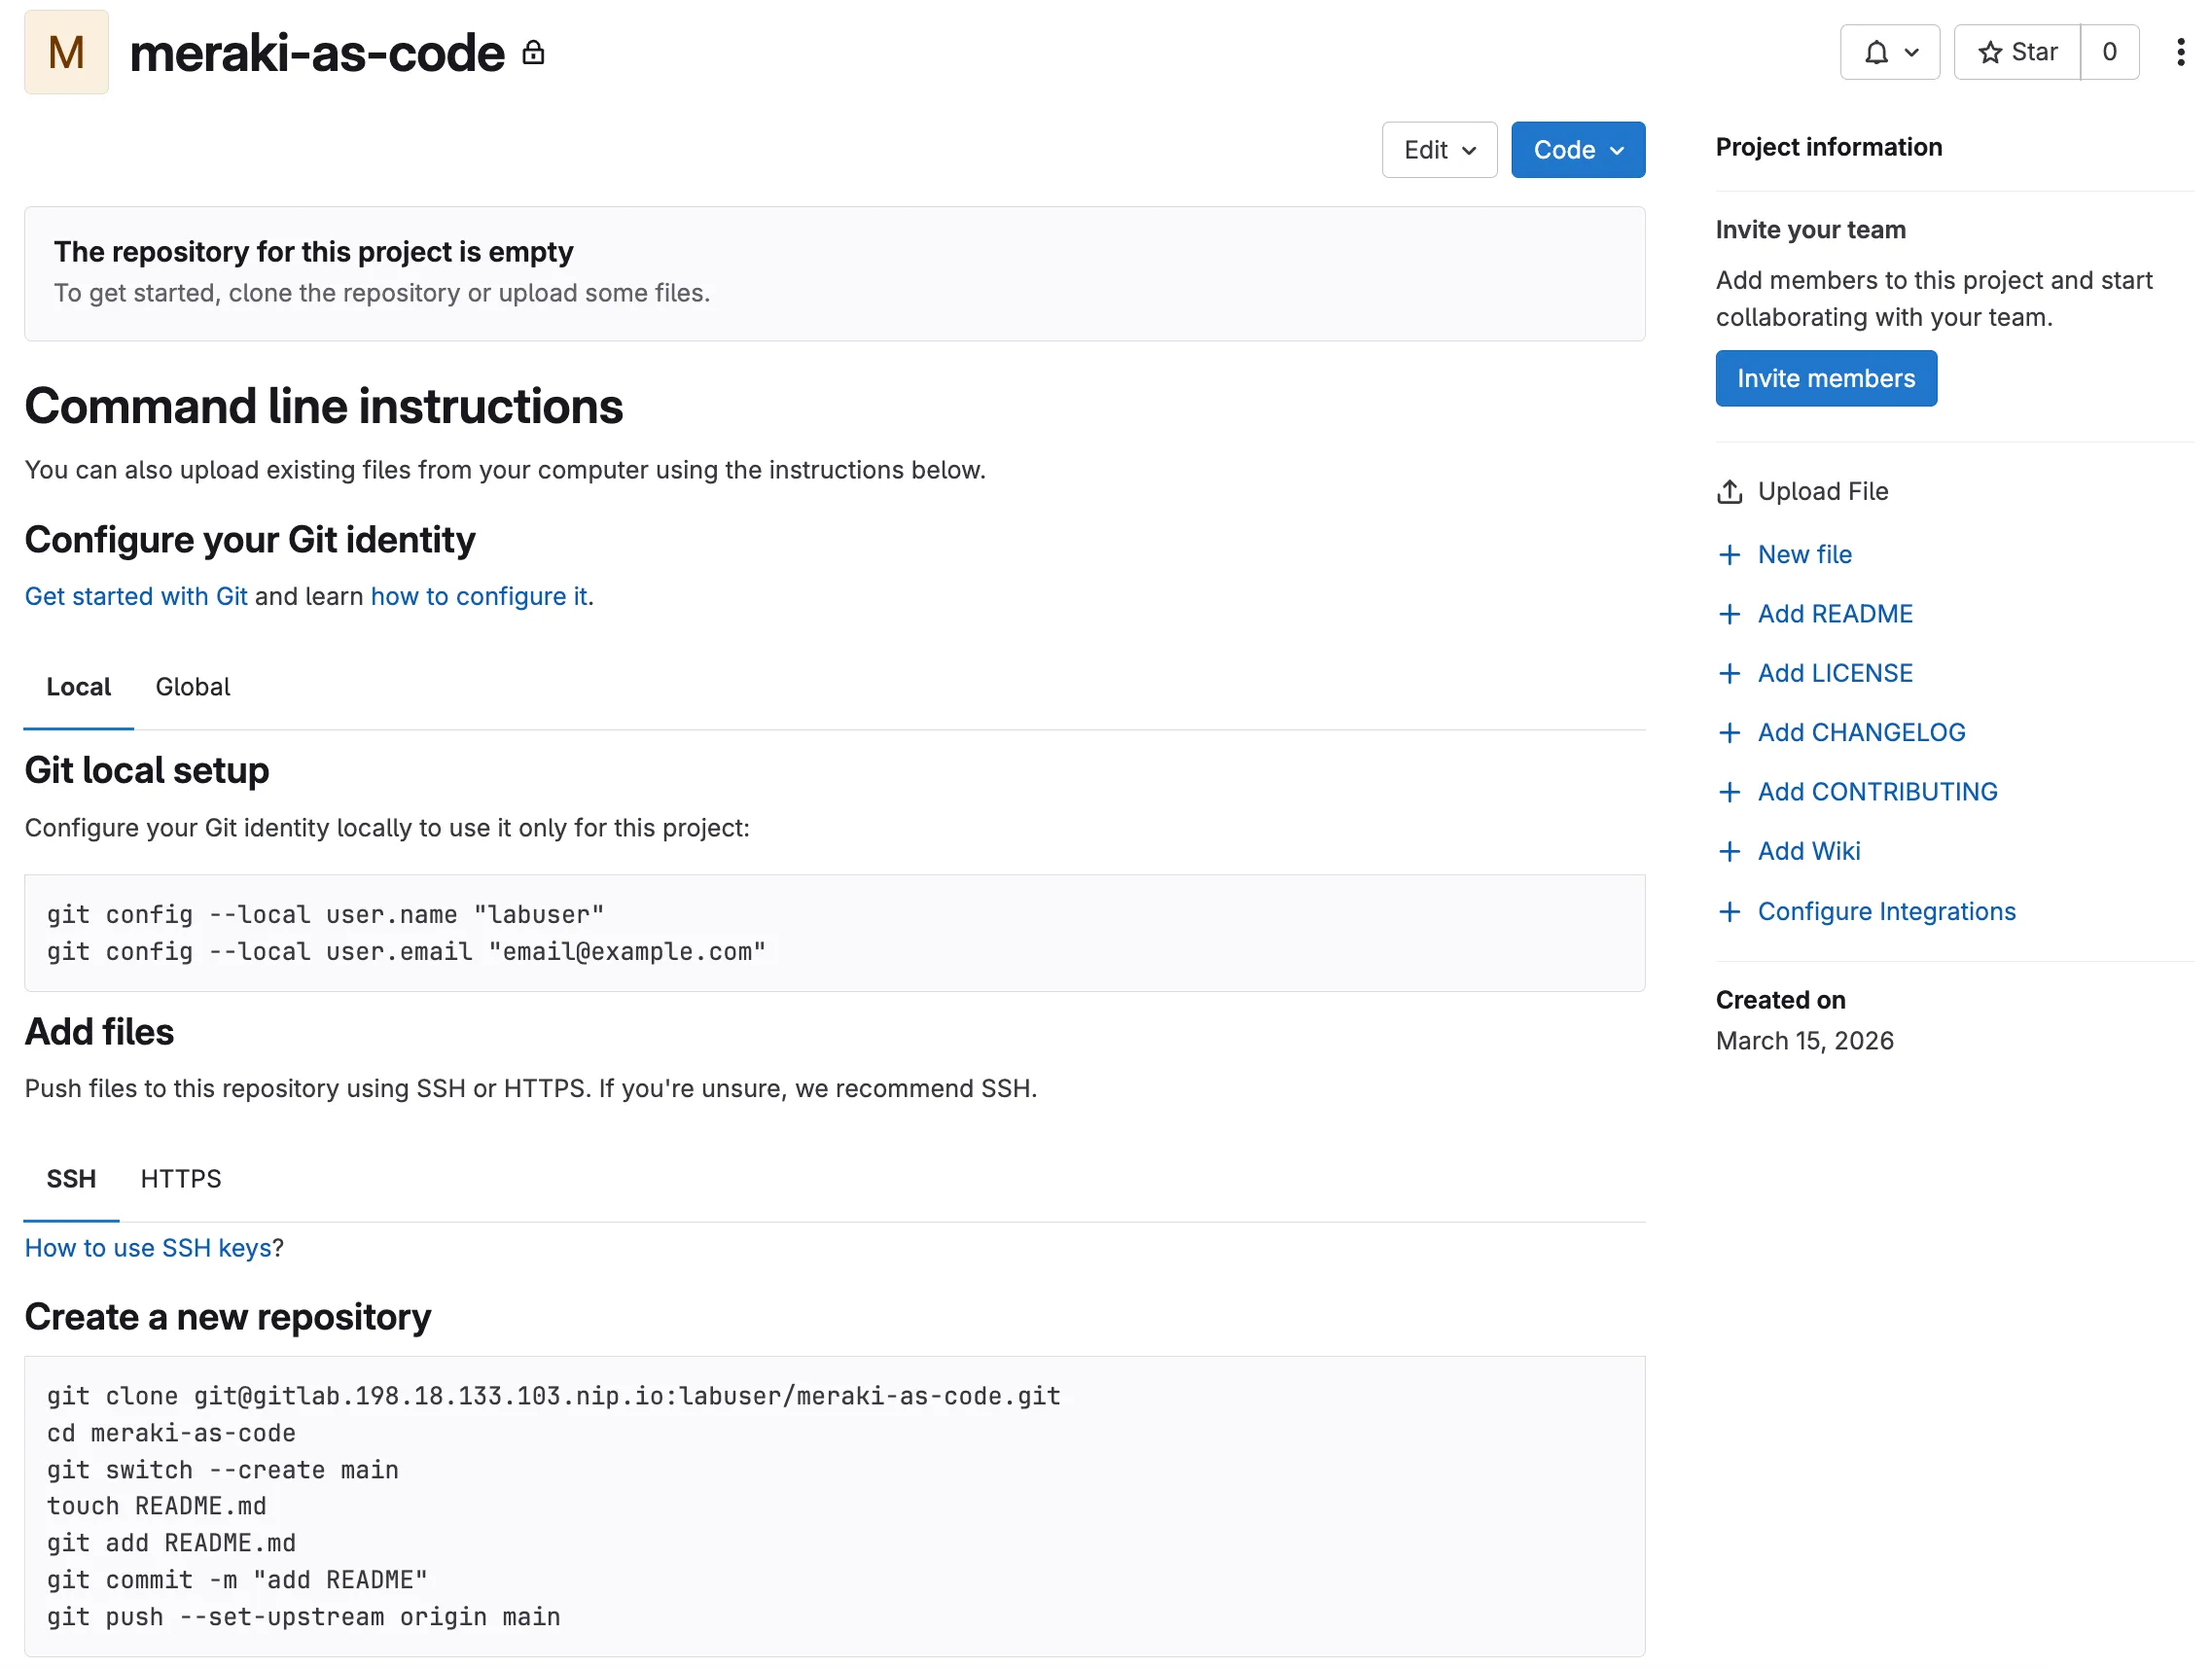
You should see an empty project page with instructions to push existing code. This is where you will connect your code server workspace to this new GitLab project.
Step 3: Check if GIT is already initialized
Section titled “Step 3: Check if GIT is already initialized”When you set up your workspace in the Meraki as Code Setup section, you cloned the NetAsCode example repository. This gave you the working code, but it also connected your workspace to the original NetAsCode repository on GitHub.
In the steps, we did disconnect from that repository and connect to your new GitLab project instead. In the previous steps we deleted the .git directory. While there are advanced Git commands to change the repository URL, for better understanding in simple terms we will just initialize a new repository.
First, let’s see what repository is currently connected:
Open the Code Server and navigate to your workspace directory:
cd ~/network-as-code/meraki-as-codeCheck the current Git remote connection (this shows the repository from the previous setup section):
git remote -vIf you see the following output, you missed the step to remove the .git directory in the previous section:
origin https://github.com/netascode/nac-meraki-example (fetch)origin https://github.com/netascode/nac-meraki-example (push)Delete the GIT directory:
Open the Code Server and navigate to your workspace directory:
cd ~/network-as-code/meraki-as-codeRemove the existing Git tracking (this removes the connection to the original NetAsCode repository):
rm -rf .gitWhy do this? The
.gitdirectory contains all the version control history and remote connections. By removing it, we start with a clean slate for your own project.
Step 4: Initialize GIT repository
Section titled “Step 4: Initialize GIT repository”Initialize a new Git repository with main as the default branch:
cd ~/network-as-code/meraki-as-codegit init --initial-branch=mainWhat this does: Creates a new Git repository in your current directory. The
--initial-branch=mainoption sets the default branch name to “main” (rather than the older default “master”). This command creates the.gitdirectory and sets up the basic Git structure needed to track changes to your files.
Step 5: Configure GIT identity
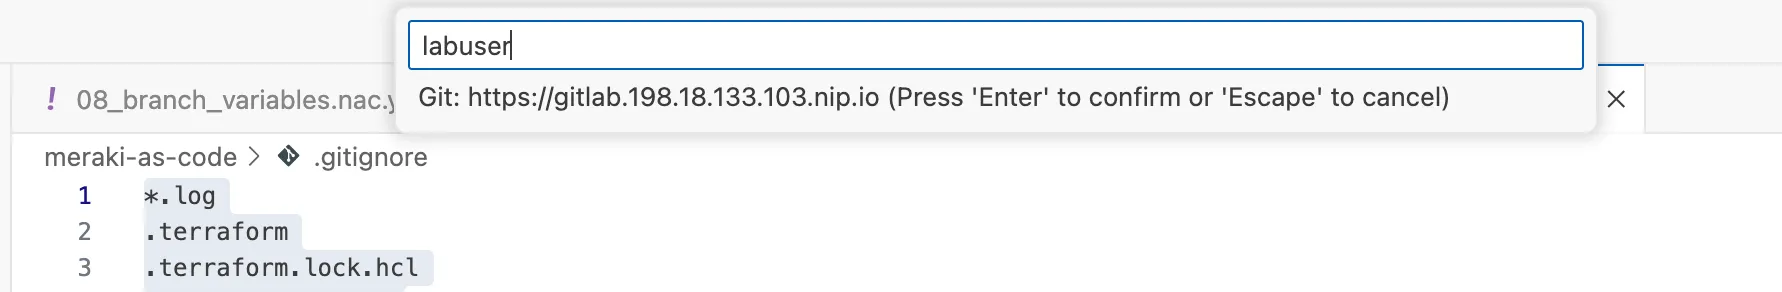
Section titled “Step 5: Configure GIT identity”Configure your Git user identity:
git config --global user.name "labuser"git config --global user.email "labuser@example.com"What this does: Sets your identity for Git commits. Every commit in Git is associated with an author, and these commands tell Git who you are. The
--globalflag means this configuration applies to all Git repositories on this system, not just the current one. When you make commits, they’ll be attributed to “labuser” with the email “labuser@example.com”. This information appears in the Git history and is important for collaboration and audit trails.
Step 6: Configure .gitignore
Section titled “Step 6: Configure .gitignore”When working with a GIT repository, it is important to exclude certain files and directories from being tracked in the repository. These are files that could be generated during automation execution, files that are not relevant to be stored that are part of execution, temporary files, or files that contain sensitive information. If you look the repository already contains a .gitignore file, but it is missing some exclusions that we want to show you. Also this step introduces you to the concept of .gitignore files.
Evaluate the .gitignore file to exclude test results and temporary files:
*.log.terraform.terraform.lock.hclterraform.tfstateterraform.tfstate.backupworkspaces/.terraformworkspaces/.terraform.lock.hclworkspaces/terraform.tfstateworkspaces/terraform.tfstate.backupworkspaces/merged_configuration.nac.yaml.envtflint.hcltests_resultstf_backend.tf.backup.ds_storeIf needed, you can add any other files to be excluded. We already provided configuration to exclude all Terraform state and log files, logs, environmental variables, parsed config, test results…
Step 7: Configure remote GIT repository server in GitLab
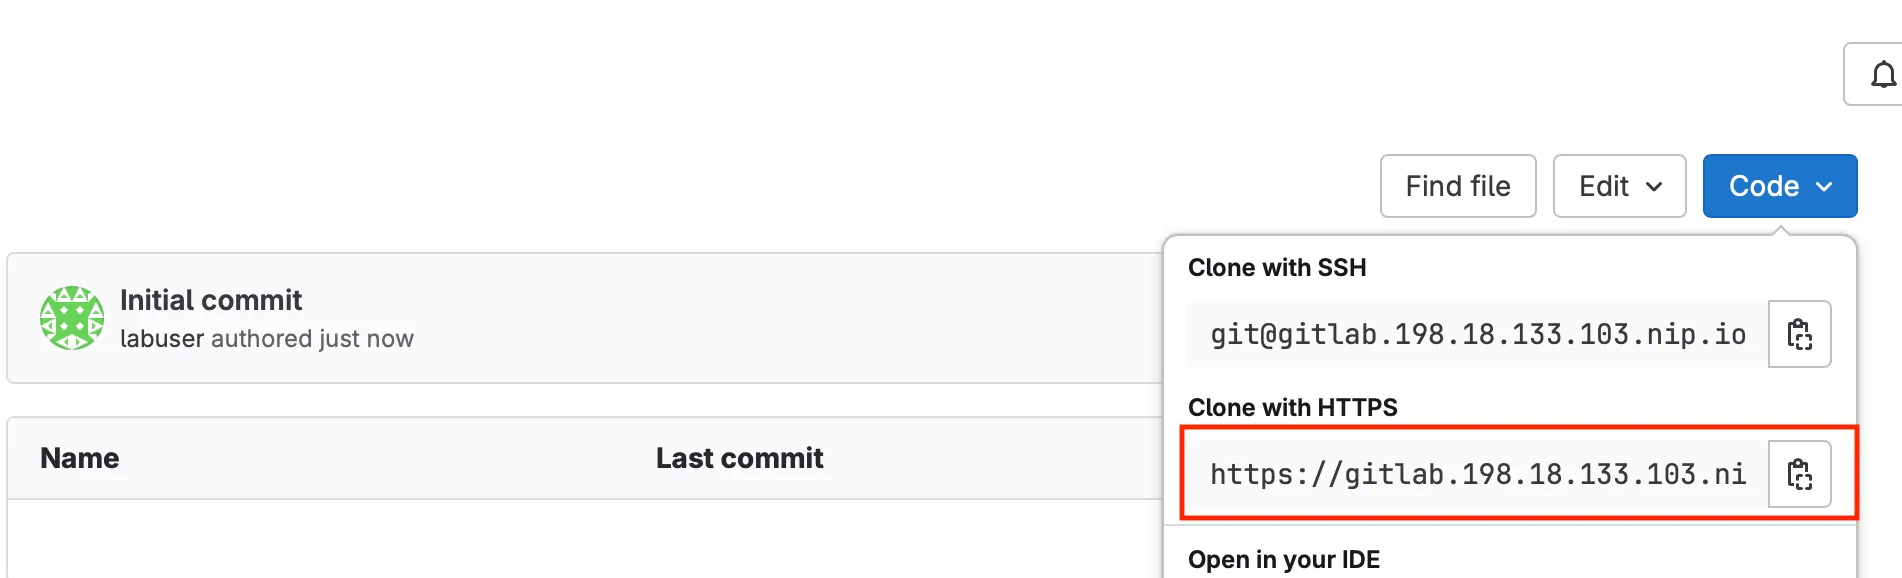
Section titled “Step 7: Configure remote GIT repository server in GitLab”Navigate to your GitLab project page, copy the repository URL (e.g., https://gitlab.198.18.133.103.nip.io/labuser/meraki-as-code.git)
Go back to your repository on code server and add your GitLab project as the remote repository:
git remote add origin https://gitlab.198.18.133.103.nip.io/labuser/meraki-as-code.gitWhat this does: Connects your local Git repository to the remote GitLab repository. “origin” is the conventional name for your primary remote repository, and this URL tells Git where to push and pull changes. Think of this as linking your local workspace to your GitLab project on the GitLab Server.
Verify the remote was added correctly:
git remote -vYou should see your GitLab URL:
origin https://gitlab.198.18.133.103.nip.io/labuser/meraki-as-code.git (fetch)origin https://gitlab.198.18.133.103.nip.io/labuser/meraki-as-code.git (push)This confirms you’ve successfully switched from the example repository to your own GitLab project!
Step 8: Add and commit your files
Section titled “Step 8: Add and commit your files”Add all your project files to Git tracking:
git config http.sslVerify falsegit checkout -b maingit add .git commit -m "Initial commit"What this does: The
git add .command stages all files in your current directory for commit (the.means “everything here”). Thegit commitcommand creates a snapshot of your staged changes with a descriptive message. This creates your first commit containing all your Network as Code configuration files, making them part of your Git history.
SSL Note: If you do not have an SSL certificate configured in your environment, you can use
http.sslVerify falseto turn off SSL certificate verification for Git operations. This is for lab environment ONLY. Do NOT disable SSL certificate in a production environment.
Push your code and set the upstream branch:
git push --set-upstream origin mainWhat this does: Uploads your local commits to the GitLab repository. The
--set-upstream origin mainpart establishes a tracking relationship between your localmainbranch and the remotemainbranch, so futuregit pushandgit pullcommands know where to send/receive changes.
This streamlined approach ensures you have a clean start with your own GitLab project, avoiding any confusion with existing remotes or Git history.
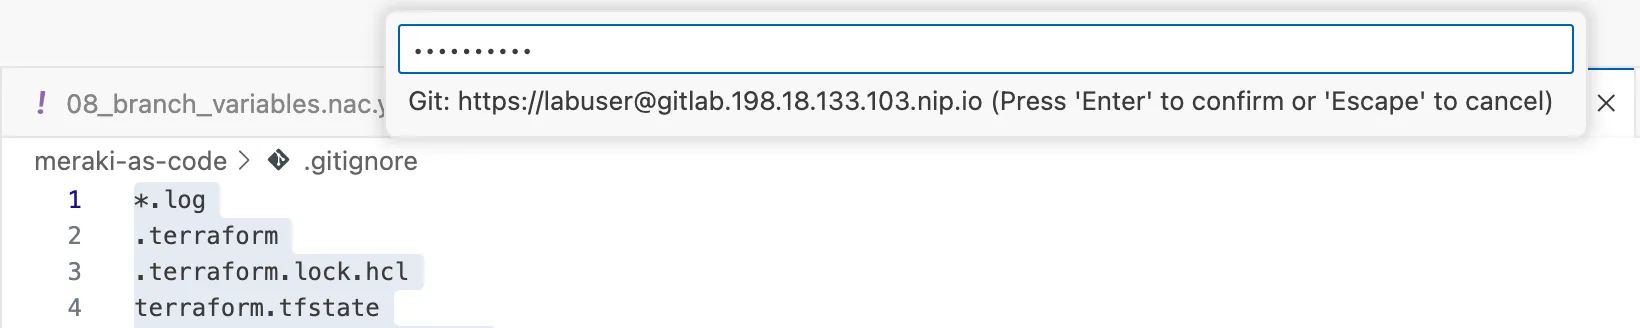
You will be asked to authenticate. Use your credentials:
Step 9: Verify GitLab Integration
Section titled “Step 9: Verify GitLab Integration”Since your workspace already contains a .gitlab-ci.yml file, the pipeline should have triggered automatically when you pushed. Let’s verify the setup:
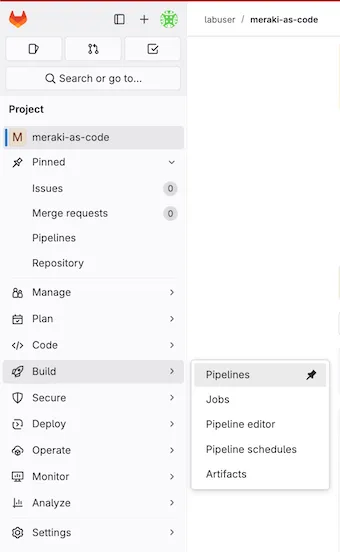
Verify the Pipeline: Navigate to your GitLab project in the browser to confirm all files are present and then the pipeline status.
- Go to Build > Pipelines in your GitLab project to see the pipeline status
- The pipeline failure is expected at this point - we’ll fix it later.

Expected Pipeline Behavior: Since you pushed with a .gitlab-ci.yml file, GitLab will automatically start a pipeline. This first pipeline will likely fail because the data folder and CI/CD variables are not configured yet. This is normal and expected.
If you navigate to the log of the failed stage, you will see the error that confirms that environment variables are not set.
╷│ Error: Invalid provider configuration││ Provider "registry.terraform.io/ciscodevnet/meraki" requires explicit│ configuration. Add a provider block to the root module and configure the│ provider's required arguments as described in the provider documentation.│╵╷│ Error: Unable to find API key││ with provider["registry.terraform.io/ciscodevnet/meraki"],│ on <empty> line 0:│ (source code not available)││ API key cannot be an empty string╵💡 Understanding Pipeline Triggers:
GitLab automatically triggers pipelines when you push commits that include a
.gitlab-ci.ymlfile. Since your workspace already has this file, the pipeline will run immediately. The initial failure is normal and will be resolved once you configure the required variables and have some valid YAML indatafolder.
Step 10: Create a Project Access Token in GitLab
Section titled “Step 10: Create a Project Access Token in GitLab”Several pipeline stages need to authenticate with GitLab — the Terraform HTTP backend stores state via the GitLab API, and the pipeline posts plan summaries as merge request comments. Both require a token. A Project Access Token is scoped to this specific project (unlike a Personal Access Token tied to your user account), which limits exposure and follows the principle of least privilege.
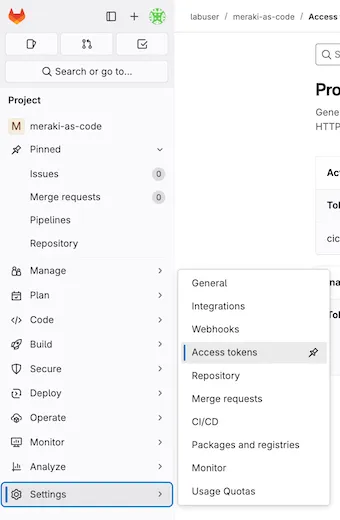
- In your GitLab project, go to Settings > Access Tokens in the left sidebar
- Enter a descriptive Token name (e.g.,
cicd-pipeline) - Set an Expiration date (or leave blank for no expiry in a lab environment)
- Select the Role:
Maintainer - Under Select scopes, check:
api— Full API access, required for Terraform state storage and merge request comments
- Click Create project access token
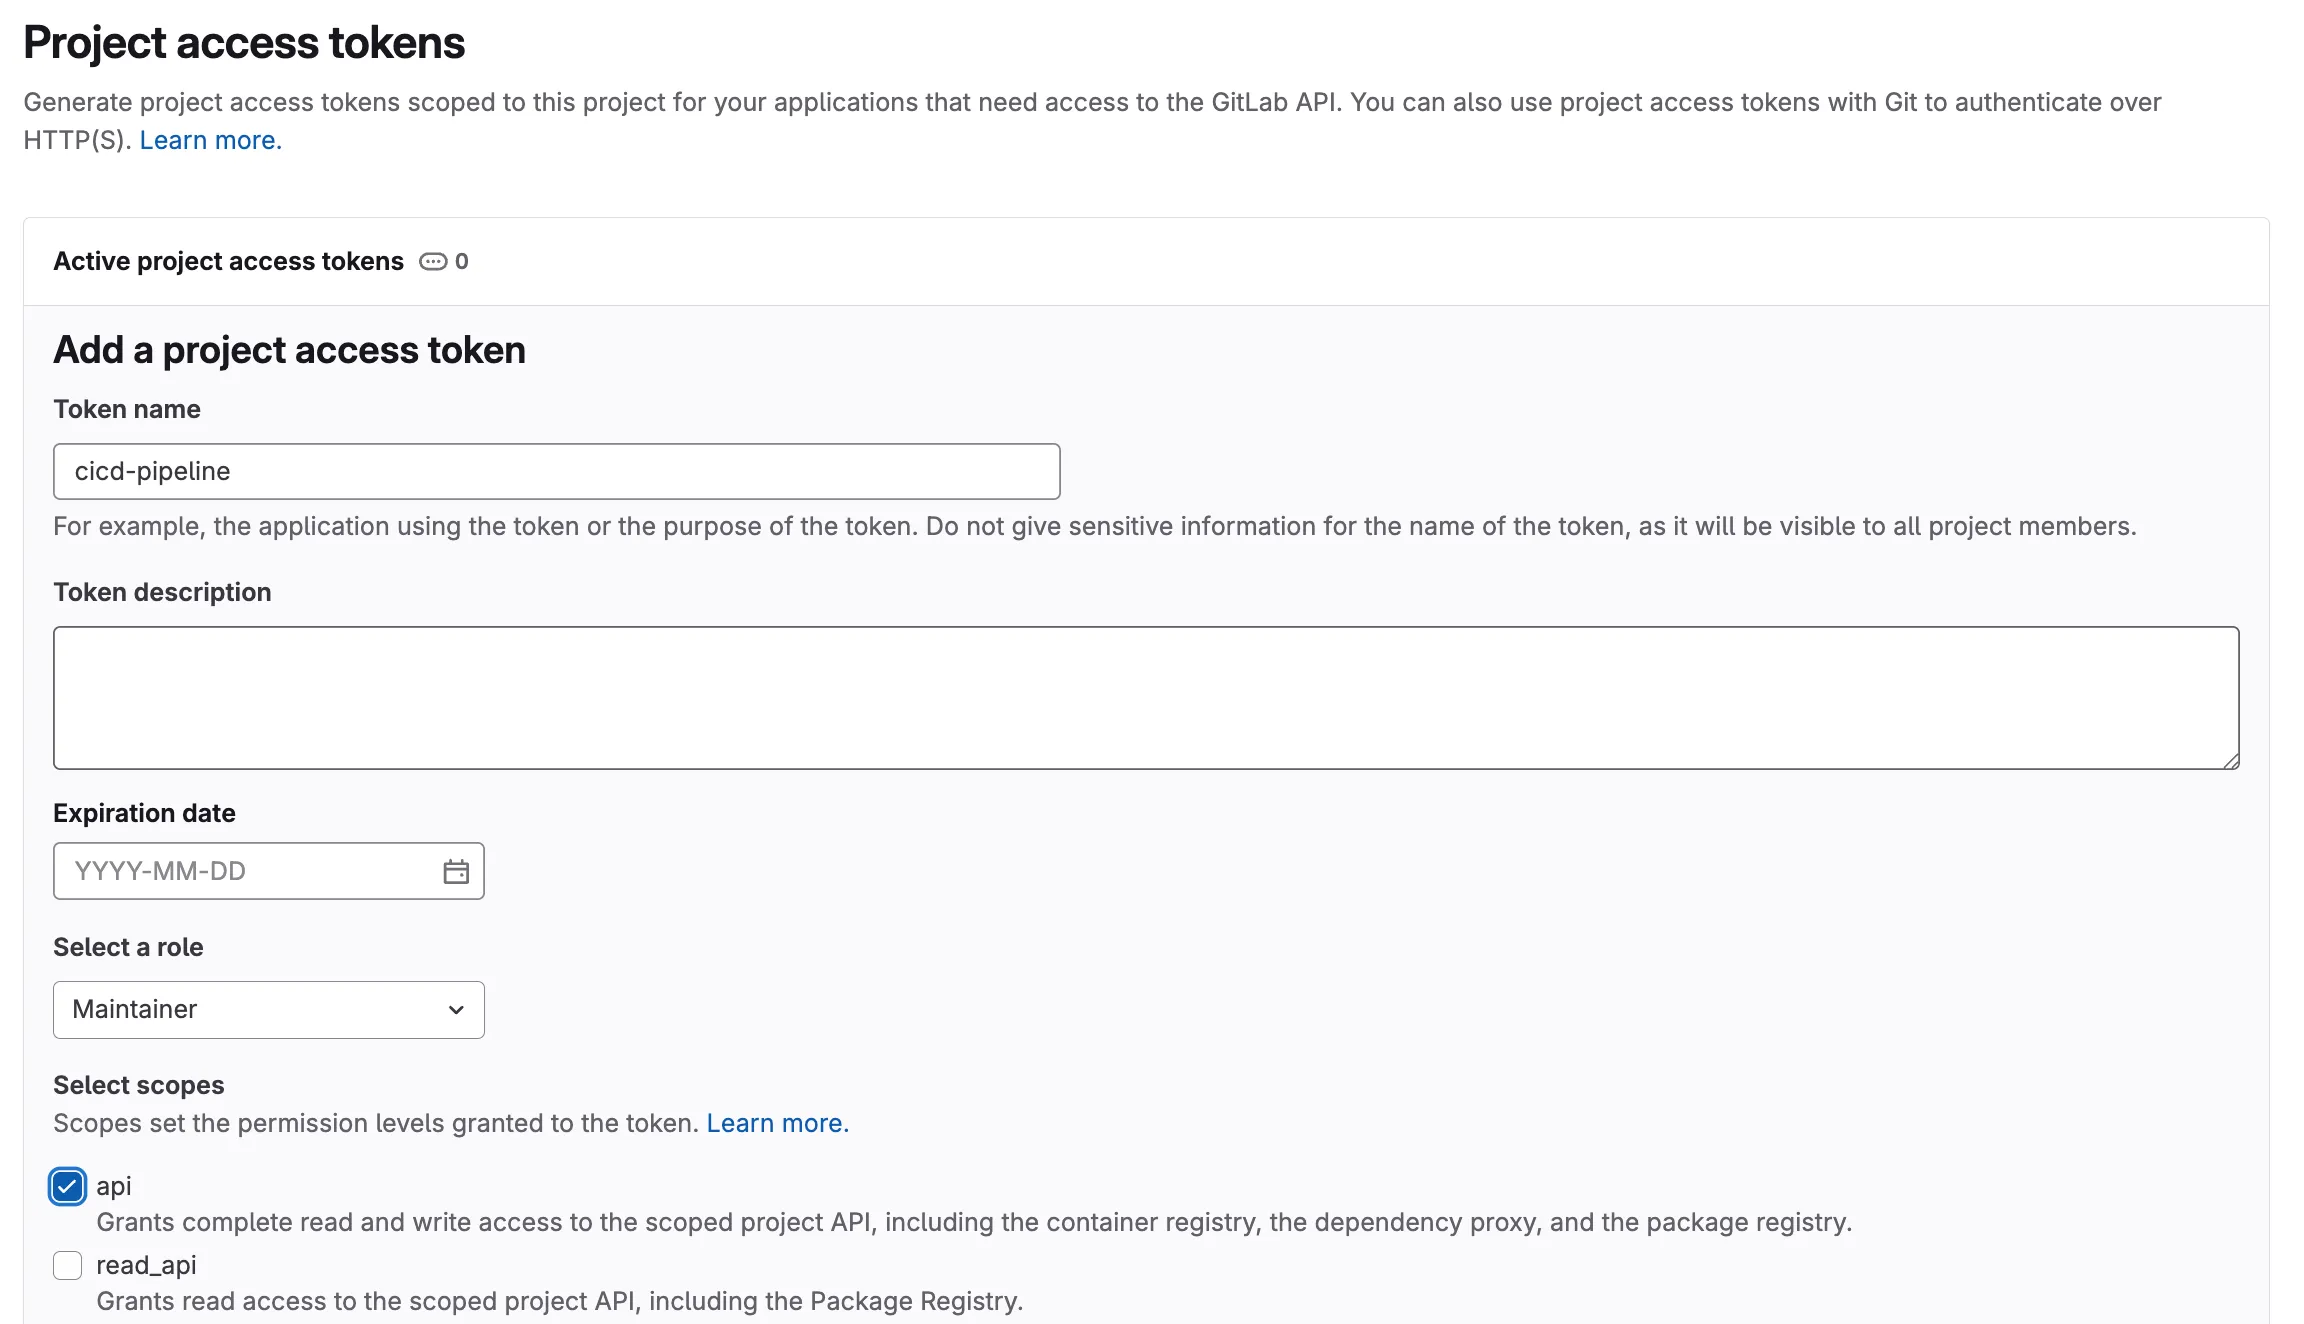
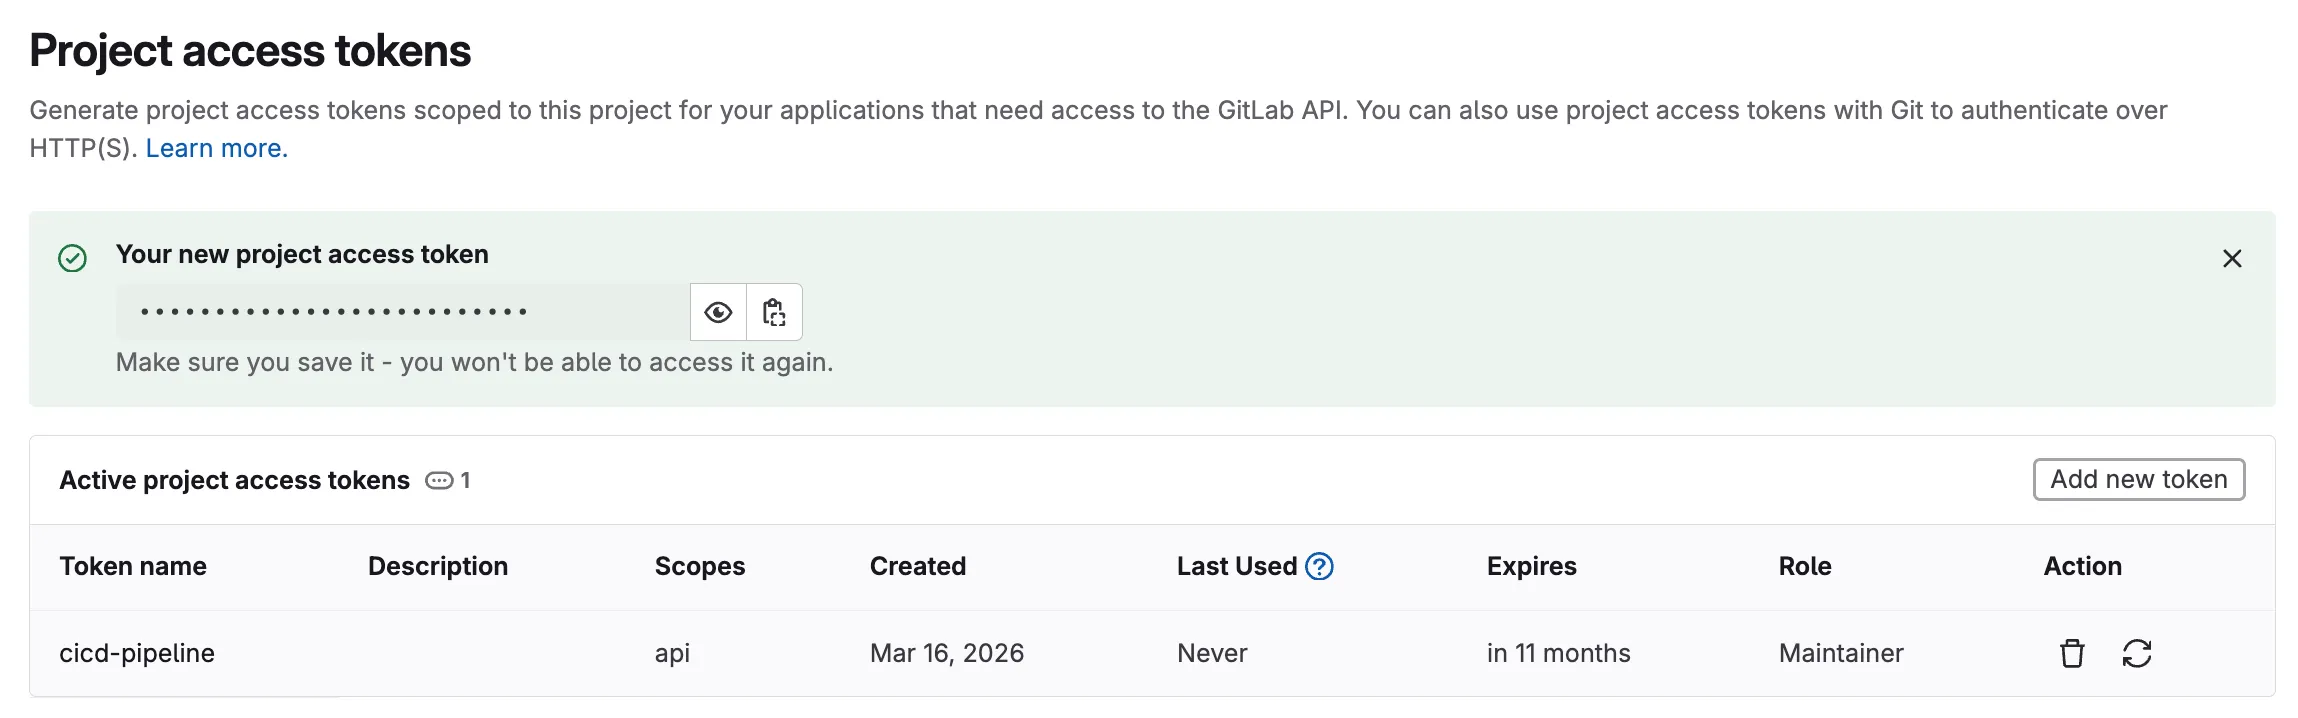
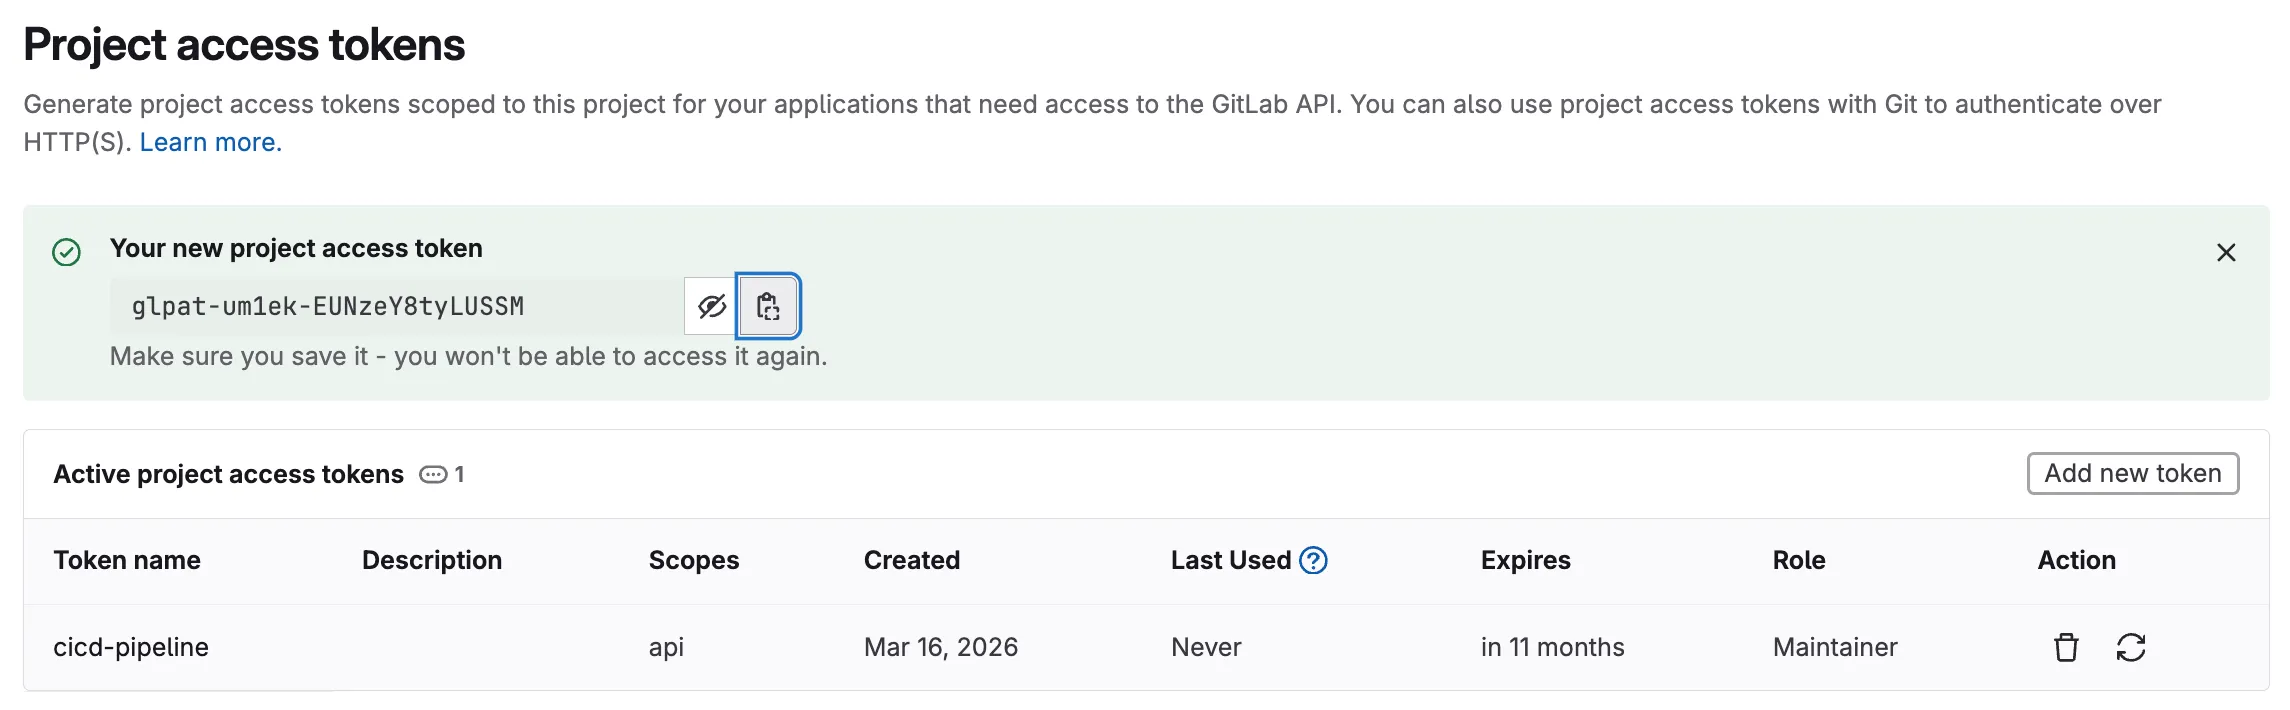
Why a Project Access Token? In production, project-scoped tokens are preferred over personal tokens because they are tied to the project rather than an individual user. If a team member leaves, the token continues to work. They can also be rotated independently without affecting other projects.
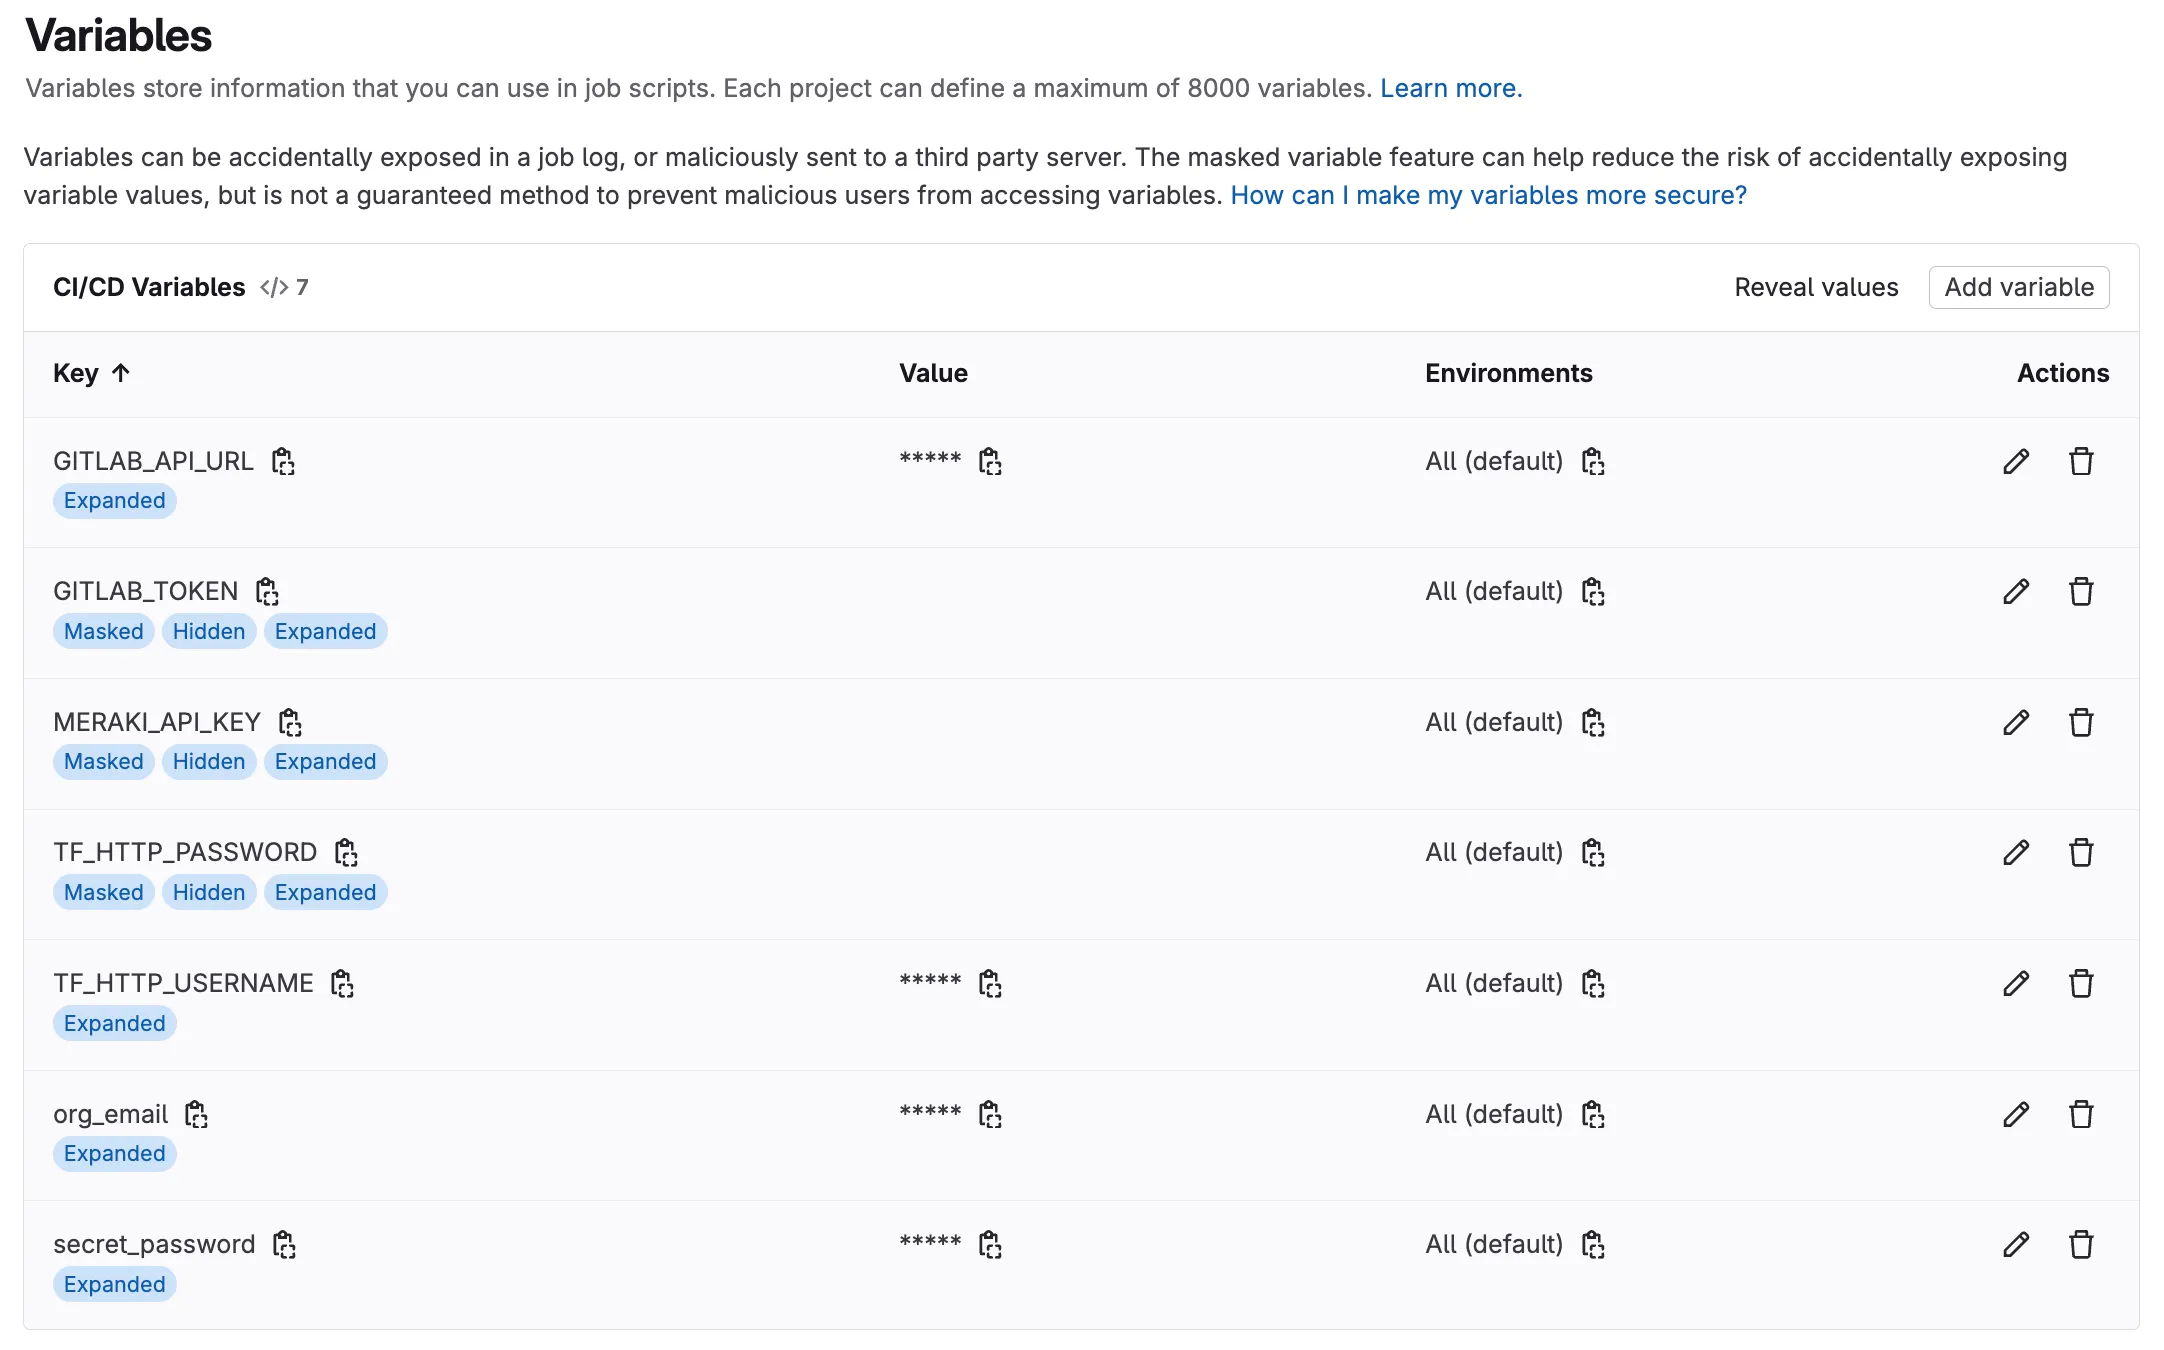
Step 11: Set Variables in GitLab
Section titled “Step 11: Set Variables in GitLab”Configuring CI/CD Variables in GitLab
Section titled “Configuring CI/CD Variables in GitLab”GitLab CI/CD variables provide a secure way to store sensitive information like credentials and configuration parameters that your pipeline needs to execute. These variables are encrypted and can be masked in logs to prevent accidental exposure.
Why use CI/CD variables instead of storing credentials in code?
- Security: Credentials are encrypted and separated from your code repository
- Flexibility: Different environments (dev, staging, production) can use different values
- Compliance: Sensitive data is not stored in version control history
- Team Collaboration: Team members can access the pipeline without seeing sensitive credentials
Understanding protected and masked variables
Section titled “Understanding protected and masked variables”When working with variables inside of any CI/CD platform, the variables are often classified into categories. This is used to protect the variables from being exposed on execution. When working with a pipeline, the pipeline definition file contains the details of the execution.
The pipeline definition file specifies what is to execute based on branching. As an example, a operator might have permissions as a user of the source code manager ( GitLab ) to create a new branch and make changes to that branch. However, the operator may not have permissions to push changes into the primary or main branches. Those primary or main branches are what is known as protected branches.
By using protected branches, the operator can make changes to the code, but those changes will not be pushed into the main branch until they are approved by a senior operator or some other process is followed during a merge request or pull request. By protecting variables, the source code manager (SCM) doesn’t allow unprotected branches access to those credentials that are marked protected. Even if the automation would execute, it would fail since it has no way to connect to the devices or controllers.
Inside of GitLab, variables are set as:
Visibility Options
Section titled “Visibility Options”- Visible: Variables will be visible in job logs.
- Masked: Prevents the variable value from being displayed in job logs. Use this for sensitive data like passwords.
- Masked and hidden: Similar to Masked, but also hides the variable value in the UI.
- Protected: Restricts the variable to protected branches and tags. Use this for variables that should only be available in production or secure environments.
- Expand variable reference:
$is treated special for reference (usually always enabled).
Navigate to your GitLab project and configure the following variables:
In your GitLab project, go to Settings > CI/CD in the left sidebar
Expand the Variables section and click Add variable
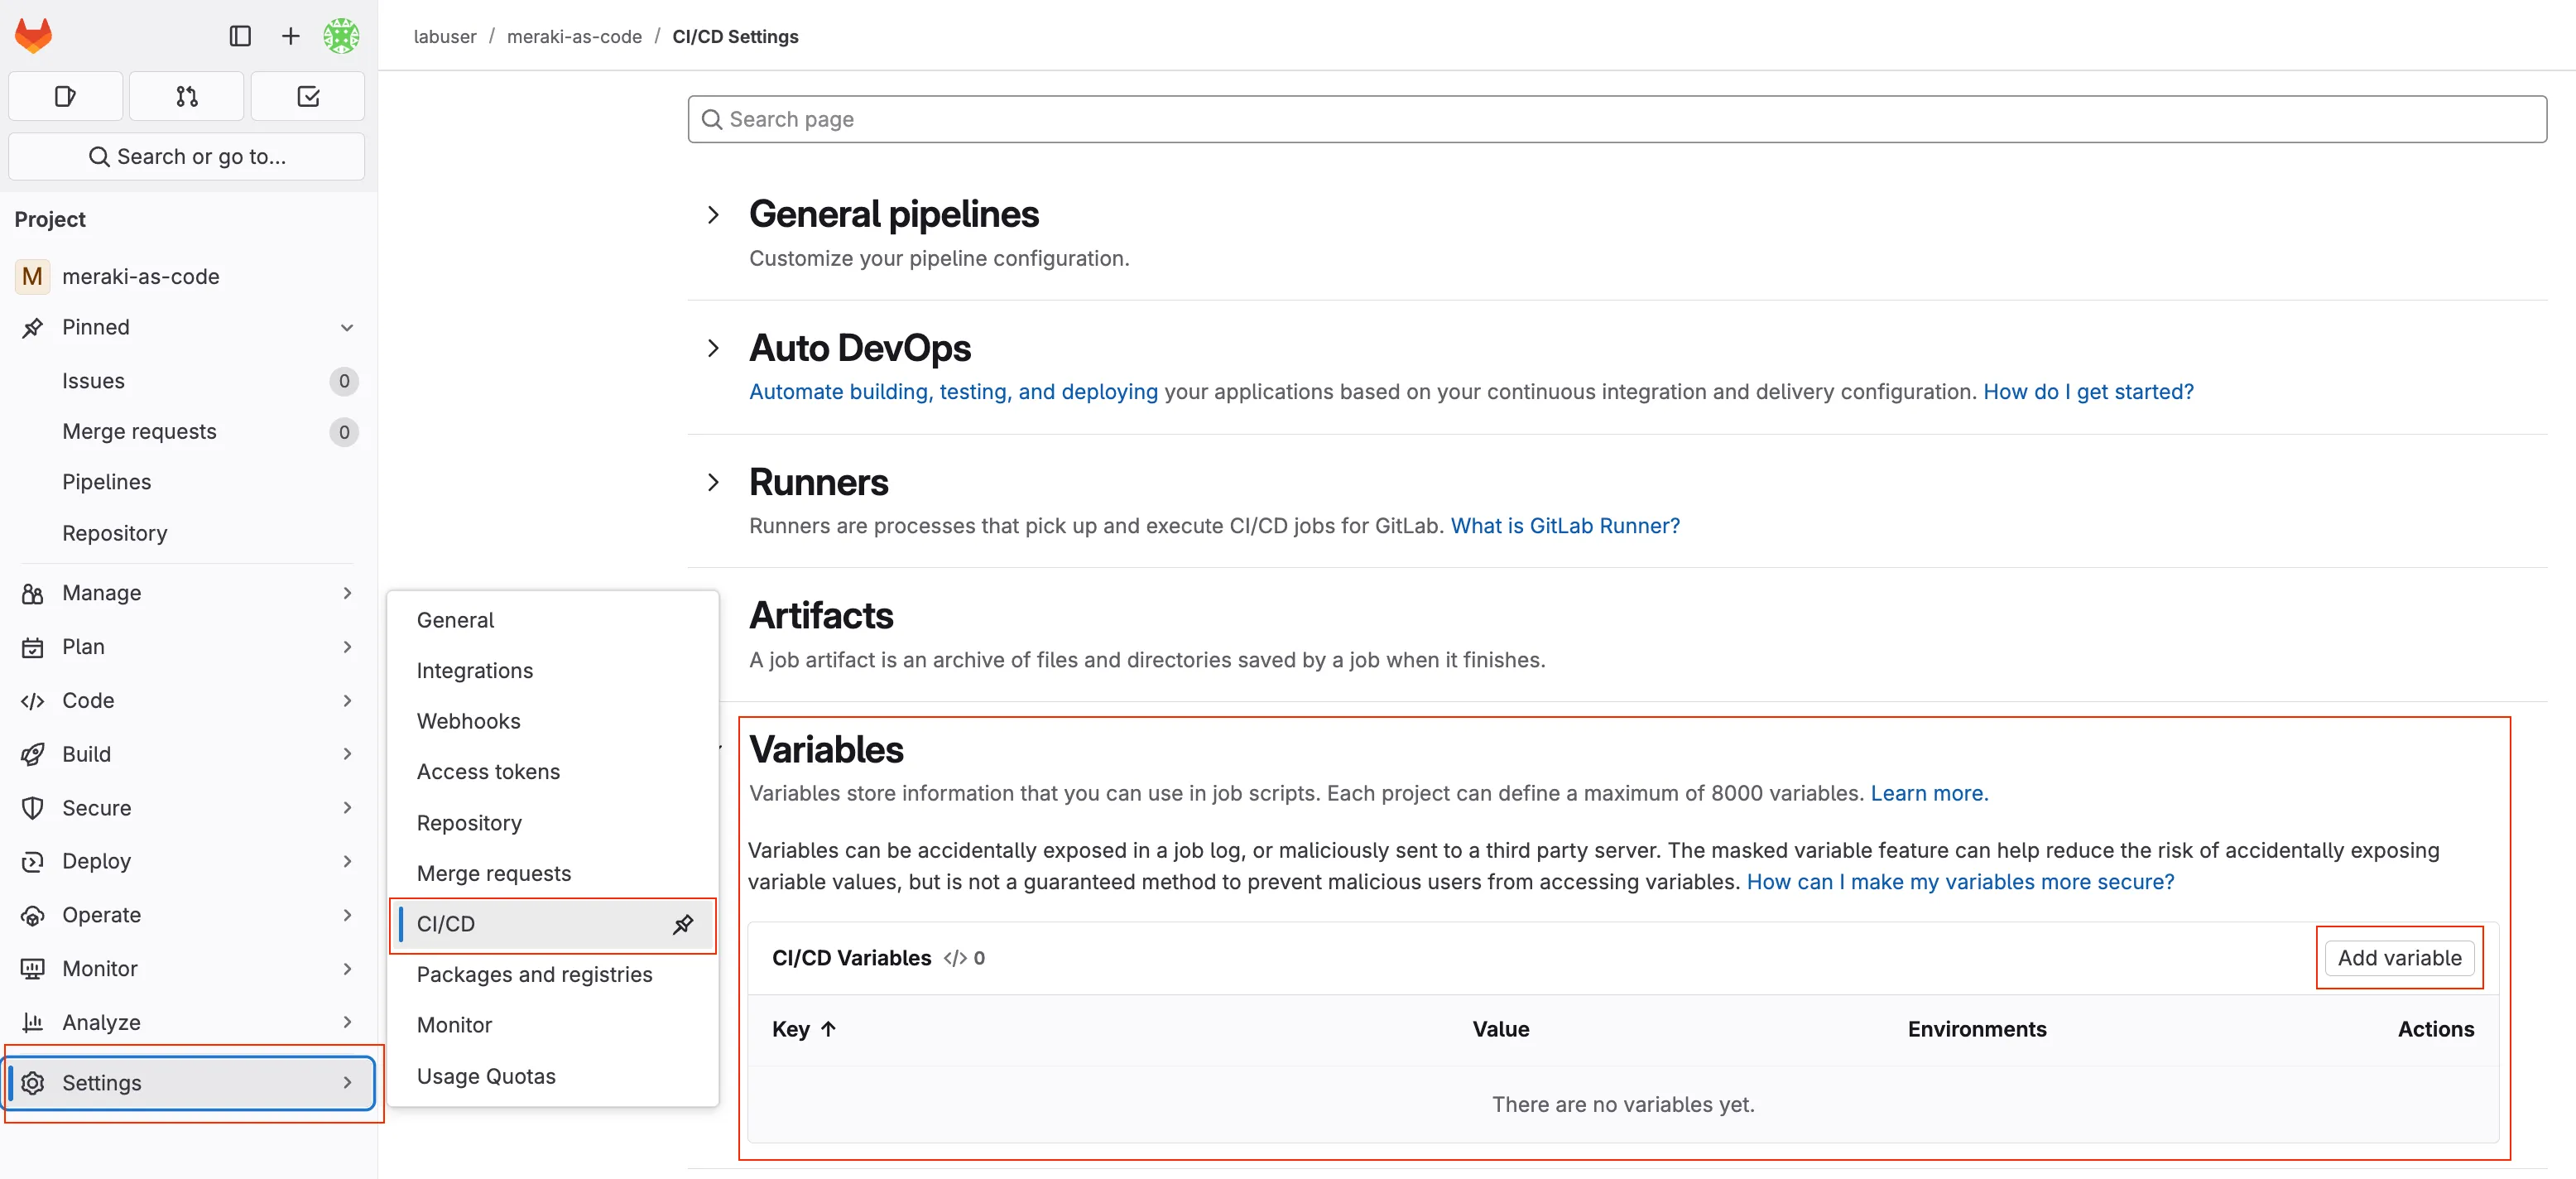
Step 12: Add Required Variables
Section titled “Step 12: Add Required Variables”Enter the Key and Value for each variable (see table below).
| Key | Value | Visibility | Flags | Purpose |
|---|---|---|---|---|
org_email | myemail@example.com | Visible | Expand | email for additional user |
secret_password | C1sco12345!!66 | Visible | Expand | Password to be used |
MERAKI_API_KEY | YOUR OWN MERAKI API KEY | Masked and hidden | Expand | Your Meraki API Key |
TF_HTTP_USERNAME | labuser | Visible | Expand | gitlab username |
TF_HTTP_PASSWORD | YOUR GITLAB TOKEN | Masked and hidden | Expand | gitlab token |
GITLAB_API_URL | https://gitlab.198.18.133.103.nip.io/api/v4 | Visible | Expand | gitlab api url |
GITLAB_TOKEN | YOUR GITLAB TOKEN | Masked and hidden | Expand | gitlab token |
Use the Add variable button for each entry, the variable section should look like below:
Note: You might be asking why we don’t have the variables marked as protected. The reason is because we haven’t configured the protected branch structure for this lab. In a production environment, you would typically have a protected branch (e.g.
main) where you would then set the password as protected. In some environments, we also want to mask some variables, but that can make troubleshooting more difficult.
💡 Pro Tip: For production environments, consider using different variable values for different branches (development, staging, production) to maintain environment isolation.
Step 13: Enable the Terraform HTTP Backend
Section titled “Step 13: Enable the Terraform HTTP Backend”When running Terraform locally in earlier tasks, the state was stored in a local terraform.tfstate file on your machine. In a CI/CD pipeline, the runner environment is ephemeral — it starts fresh for every job — so local state would be lost between runs. To solve this, we configure Terraform to store its state remotely using GitLab’s built-in HTTP backend.
Your main.tf already contains the backend configuration, but it is commented out. Open the file in Code Server:
code-server main.tfThe top of the file looks like this:
# terraform {#   backend "http" {#     skip_cert_verification = true#   }# }
module "meraki" {  source           = "github.com/netascode/terraform-meraki-nac-meraki"  yaml_directories = ["data"]}
Uncomment the first five lines by removing the # characters so the file looks like:
terraform {  backend "http" {    skip_cert_verification = true  }}
module "meraki" {  source           = "github.com/netascode/terraform-meraki-nac-meraki"  yaml_directories = ["data"]}
Save the file.
The pipeline’s CI/CD variables (TF_HTTP_ADDRESS, TF_HTTP_USERNAME, TF_HTTP_PASSWORD) — already defined in your .gitlab-ci.yml — tell Terraform where to store and retrieve state. This enables the pipeline to track what has been deployed across runs and correctly calculate changes on each commit.
Next Steps: Demonstrating Pipeline with Configuration Deploy
Section titled “Next Steps: Demonstrating Pipeline with Configuration Deploy”Now that your variables are configured, let’s demonstrate the pipeline’s power by deploying network configurations.
This exercise demonstrates several key Infrastructure as Code principles by implementing declarative configuration where you define the desired state and let automation handle implementation, leveraging version control to track exactly what changes were made and when, ensuring automated validation to verify changes are valid before deployment, providing controlled deployment that applies changes only after validation and approval, and including comprehensive verification to confirm changes were applied correctly. This practical demonstration bridges the theoretical concepts with real-world network operations management.
Step 14: Add Organization and Networks
Section titled “Step 14: Add Organization and Networks”In the previous tasks, you built up the configuration step by step — first creating the organization, then adding networks, wireless, switch, and appliance settings. Now, we will deploy all of that configuration at once through the pipeline.
Copy the following files from lab-data/ to data/:
cp lab-data/01_create_org.nac.yaml data/cp lab-data/02_configure_network.nac.yaml data/cp lab-data/03_add_wireless.nac.yaml data/cp lab-data/04_switch_settings.nac.yaml data/cp lab-data/05_add_firewall_sdwan_settings.nac.yaml data/These five files together define the complete intended state for your Meraki organization — including the organization itself, network settings, wireless SSIDs, switch port configurations, and appliance firewall and SD-WAN rules. By committing them all at once, the pipeline will validate, plan, deploy, and test the entire configuration in a single run.
Step 15: Commit and Push Changes
Section titled “Step 15: Commit and Push Changes”The first command you will run is git status to check what files have changed since your last commit. This is a command that you will run often when working with GIT. It shows you which files have been modified, added, or deleted in your working directory and also notifies you of new files that are not yet tracked by GIT. If you where to create a new file, it would show up as an untracked file. This means you would first have to add the file with git add <filename> before you can add it in the repository.
git statusSince we added new files (not modified existing ones), git status will show them as untracked. We need to stage them with git add before committing. The git add . command stages all new and modified files in the current directory.
git add .The git commit command creates a new snapshot of your changes with a descriptive message explaining what changed and why. The -m flag allows you to provide a commit message directly in the command. It is a good practice to write clear and concise commit messages that explain the purpose of the change. Bad commit messages can make it difficult to understand the history of your project and the reasons behind changes.
git commit -m "Add organization and network configuration"Finally after you have done the commit, you will push your changes to the remote GitLab repository. This uploads your new commit to GitLab, which automatically triggers the CI/CD pipeline defined in your .gitlab-ci.yml file.
git push origin mainYou may be asked to authenticate with your CICD at this point.
Understanding the Git Workflow:
git statusshows which files have been modified since your last commitgit diffdisplays the exact line-by-line changes you made to specific filesgit addstages specific files for commit (you can be selective about what to include)git commitcreates a new snapshot with a descriptive message explaining what changed and whygit pushuploads your new commit to GitLab, which automatically triggers the CI/CD pipeline
This workflow ensures every network change is documented, reviewable, and automatically processed through your validation and deployment pipeline.
Step 16: Monitor Pipeline Execution
Section titled “Step 16: Monitor Pipeline Execution”Navigate to GitLab Pipelines:
- Go to your GitLab project
- Click Build > Pipelines
- You should see a new pipeline triggered by your push
Watch the Pipeline Stages:
⚙️ PREPARE → 🔍 VALIDATE → PLAN → 🚀 DEPLOY → 🧪 TEST-INTEGRATION → 🧪 TEST-IDEMPOTENCY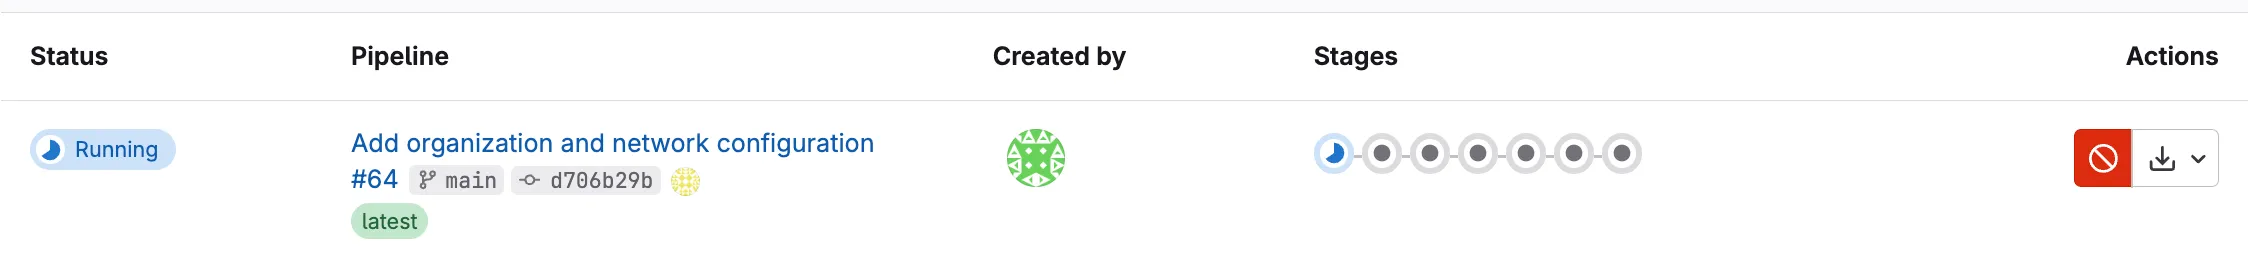
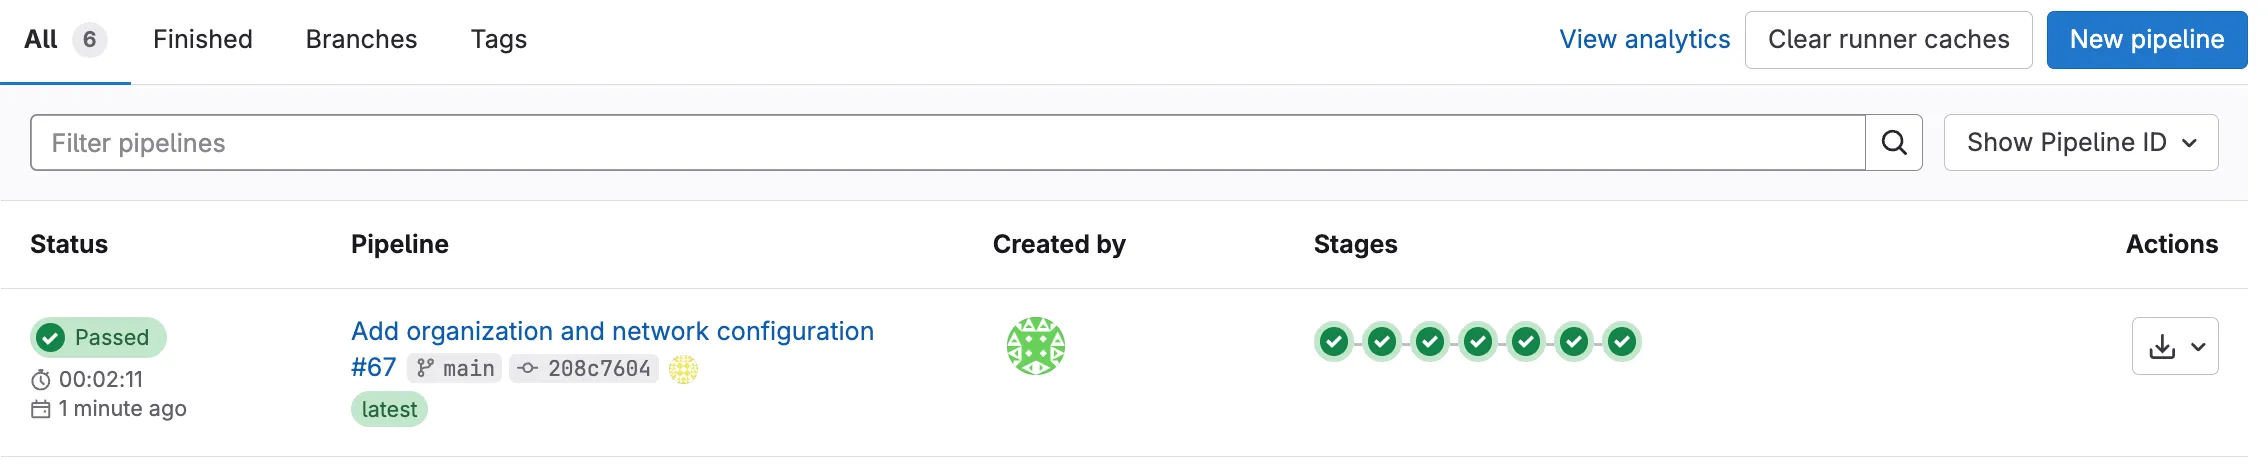
Monitor Pipeline Progress: Each stage will run according to the workflow described in Understanding Pipelines. Once the pipeline completes, you will see the status of each stage (success or failure).
Step 17: Verify in Meraki Dashboard
Section titled “Step 17: Verify in Meraki Dashboard”You can manually verify the changes in Meraki Dashboard to confirm the pipeline deployment was successful:
Step 18: Review Pipeline Test Results
Section titled “Step 18: Review Pipeline Test Results”The final stage of your CI/CD pipeline uses Robot Framework with the NaC-Test tool to verify that your deployed configuration matches the intended network state. This automated testing provides confidence that your Infrastructure as Code deployment was successful.
A network operator can view the results in two separate ways: through the GitLab pipeline interface or by downloading the test artifacts directly. nac-test provides two outputs during execution: a detailed HTML report and a JUnit-compatible XML file for integration with GitLab. The XML JUnit file is used to display the test results in the GitLab pipeline interface, that is visible if you click on the Tests tab in the pipeline details.
For the HTML report, you can download the test artifacts from the pipeline job details. This provides a comprehensive overview of the test execution, including pass/fail status, execution timeline, and detailed logs for each test case.
Navigating to Test Results in GitLab
Section titled “Navigating to Test Results in GitLab”- Go to your GitLab project
- Click on Build > Pipelines in the left navigation menu
- Select the completed pipeline you want to review (click on the pipeline status or commit message)
- Click on the test-integration job in the test stage
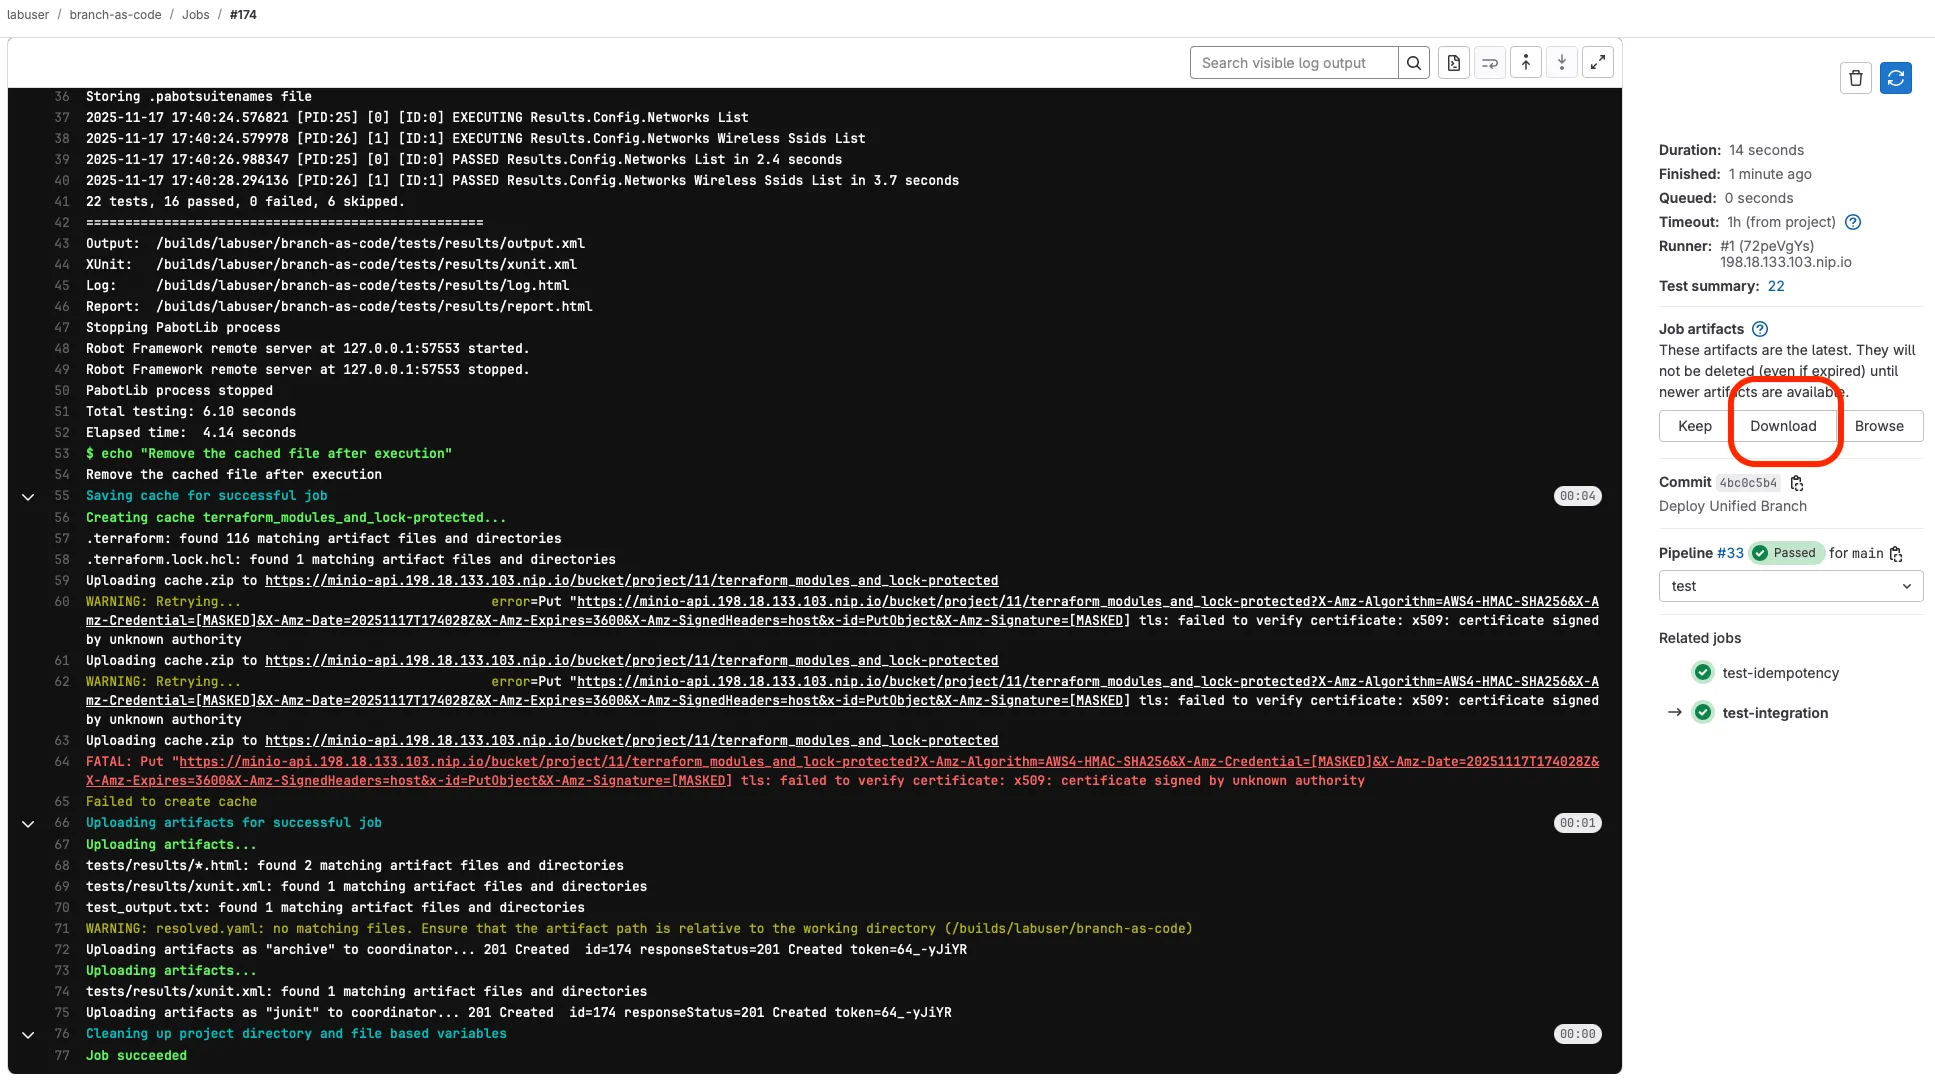
Downloading and Reviewing Test Artifacts
Section titled “Downloading and Reviewing Test Artifacts”- In the test-integration job details, scroll down to find the Job artifacts section on the right side
- Click the Download button to get the test results archive (it will download a zip file)
- Extract the downloaded zip file to your local machine to review the results
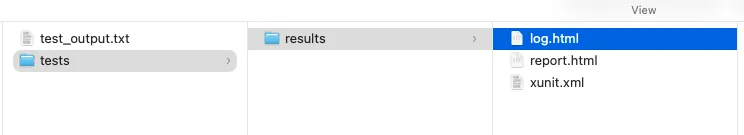
Understanding Test Report Files
Section titled “Understanding Test Report Files”- Open the extracted folder and look for these key files:
tests/results/report.html- Main test execution report with summary and pass/fail statustests/results/log.html- Detailed test execution log with step-by-step informationtests/results/xunit.xml- JUnit-compatible test results for GitLab integrationtest_output.txt- Console output from the test execution
- Open
report.htmlin your web browser to review:- Overall test suite summary (passed/failed tests)
- Individual test case results
- Execution timeline and statistics
- Links to detailed logs for failed tests
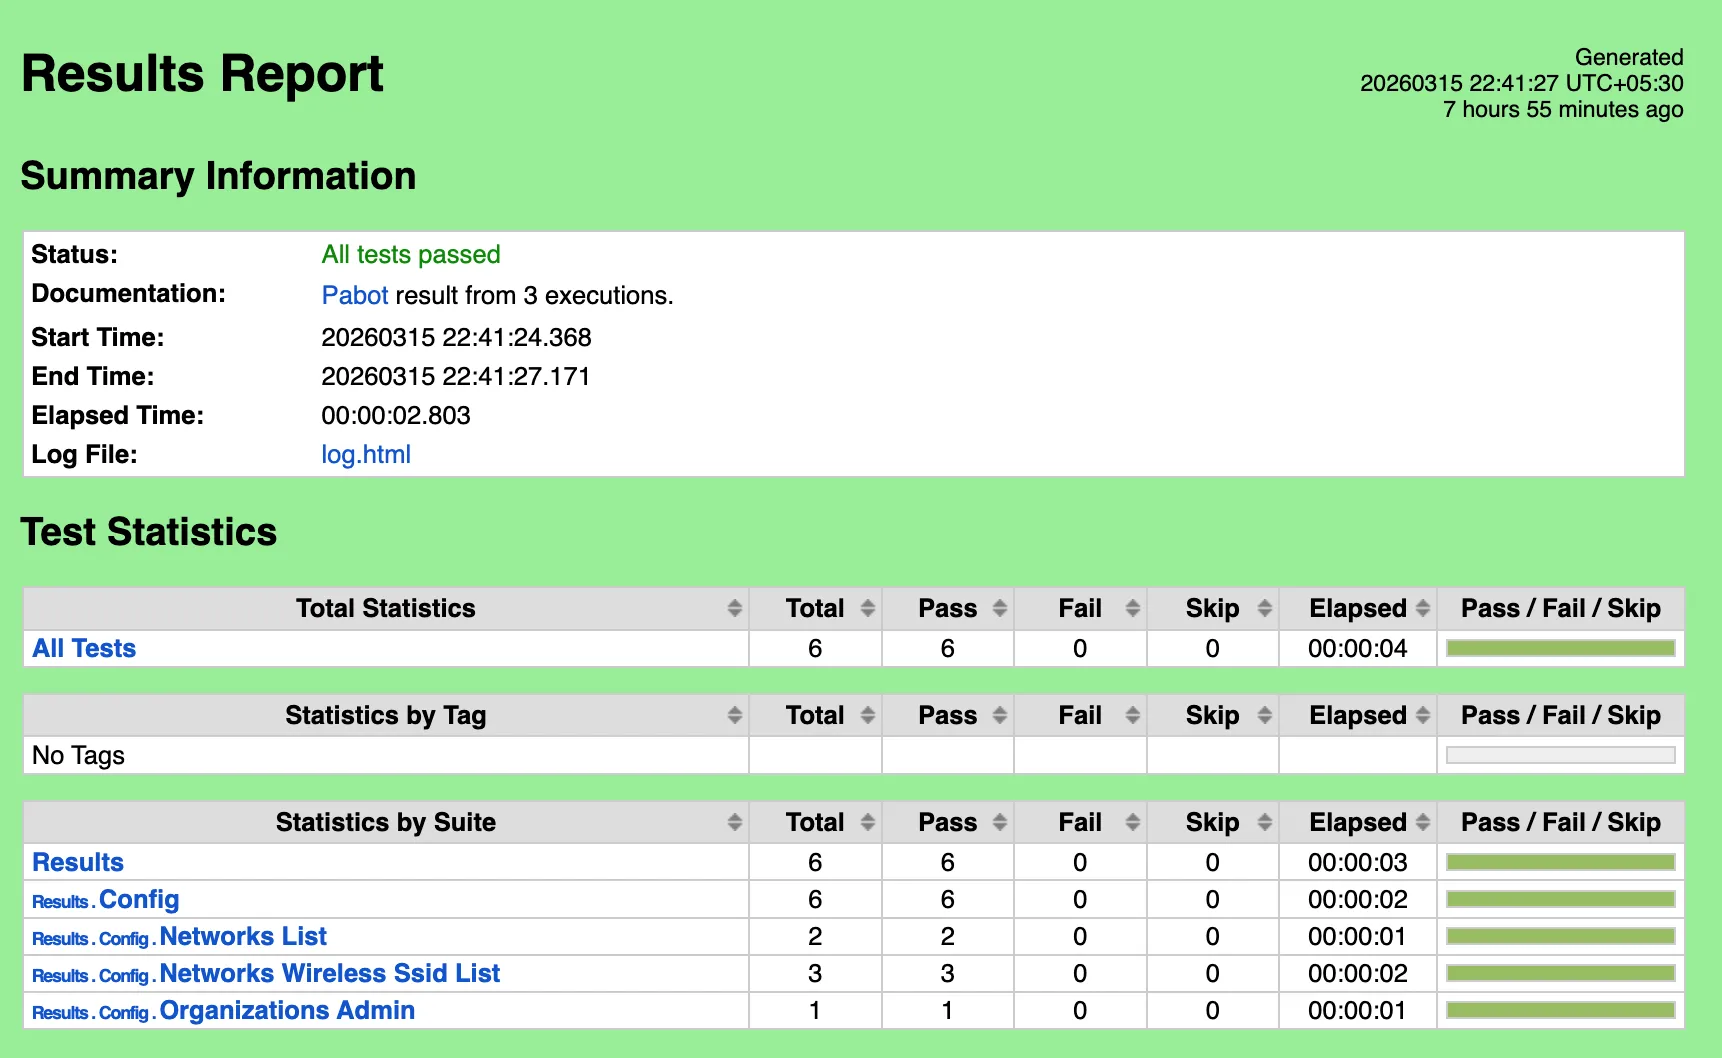
This report provides a comprehensive overview of how your deployed configuration performed against the expected state defined in your test templates.
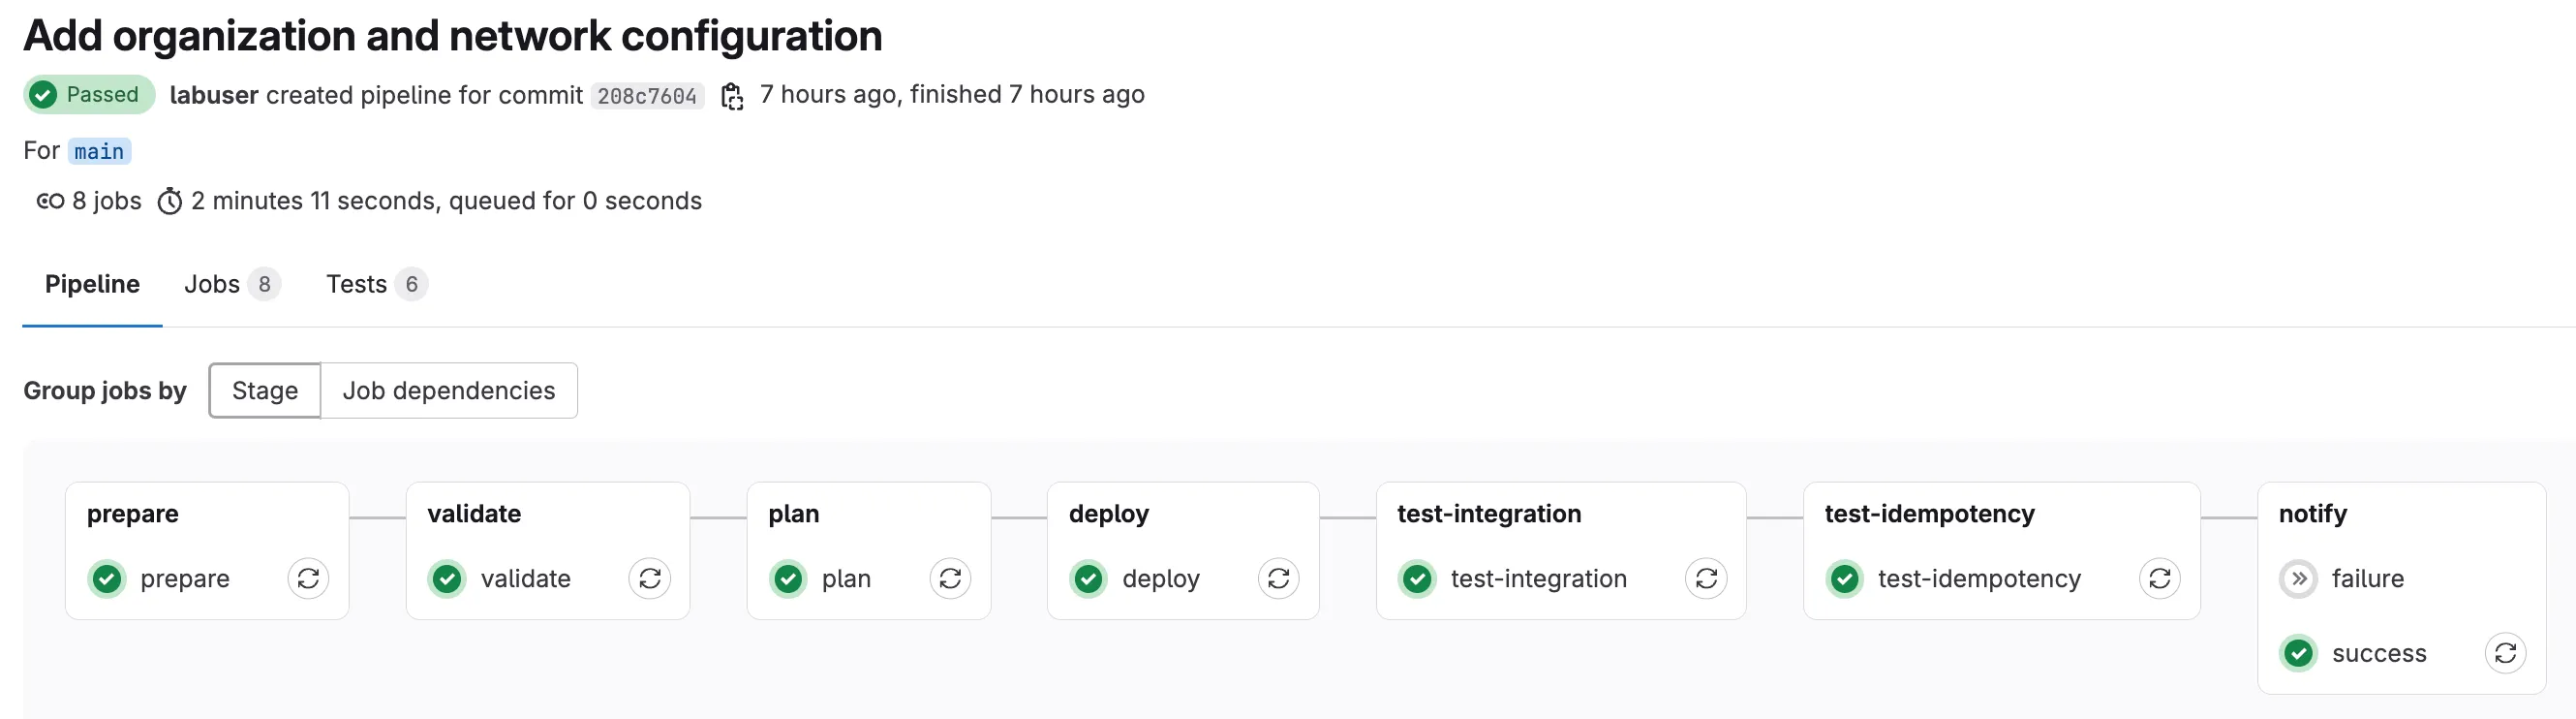
Step 19: Review Each Pipeline Stage Output
Section titled “Step 19: Review Each Pipeline Stage Output”Now that the pipeline has completed, take a moment to click into each stage and review its job log. Understanding what each stage produces helps you troubleshoot failures and gives you confidence that the automation is doing what you expect.
In your GitLab project, go to Build > Pipelines, click on the completed pipeline, and then click on each job name to open its log.
1. Prepare
Section titled “1. Prepare”This job renders templates and variables into a single merged_configuration.nac.yaml. In the log, look for:
terraform -chdir=workspaces/ init— Initializes the workspace module that performs the mergeterraform -chdir=workspaces/ apply -auto-approve— Executes the renderingmerged_configuration.nac.yaml created successfully.— Confirms the merged file was generated
If the 08_branch_variables.nac.yaml file is not present in data/, the stage prints "branch_variables file not found. Skipping prepare stage." and exits cleanly. This is expected when you are not using templates.
2. Validate
Section titled “2. Validate”This job checks Terraform formatting and validates the data model. In the log, look for:
All Terraform files are properly formatted.— Confirmsterraform fmt -checkpassed✓ Validating NAC YAML files:followed by the list of files being validated- The
nac-validateoutput — a clean run produces noERRORlines
If you see No .nac.yaml files found (after exclusions). Skipping nac-validate., it means no eligible data model files were found. Check that your files in data/ have the .nac.yaml extension.
3. Plan
Section titled “3. Plan”This job calculates what Terraform will create, modify, or destroy. In the log, look for:
terraform plan -out=plan.tfplan— The core planning command- The plan summary at the bottom, for example:
Plan: 15 to add, 0 to change, 0 to destroy. - The
+,~, and-symbols indicating resources to be created, updated, or deleted
The plan stage also generates plan_gitlab.json which GitLab uses to display the Terraform report widget on merge requests, and runs gitlab-comment.py to post a human-readable plan summary as a merge request comment.
4. Deploy
Section titled “4. Deploy”This job applies the planned changes to the Meraki Dashboard. In the log, look for:
terraform apply -input=false -auto-approve plan.tfplan— Applies the exact plan from the previous stageApply complete! Resources: X added, Y changed, Z destroyed.— The final summary
This stage only runs on the main branch. If you are working on a merge request, the pipeline stops after the plan stage so you can review before merging.
5. Test Integration
Section titled “5. Test Integration”This job runs nac-test to verify the deployed configuration matches your intended state. In the log, look for:
Running nac-test against data/— Tests the data model files (excluding template files prefixed with07_*and08_*)Running nac-test against workspaces/— Tests the rendered merged configuration (if templates were used)All nac-test runs completed successfully.— Confirms both test sets passed
If a test fails, the log will show which specific configuration item did not match. You can download the HTML report artifacts for a detailed breakdown (see Step 18).
6. Test Idempotency
Section titled “6. Test Idempotency”This job runs terraform plan a second time after deployment. A successful run means no changes are detected — the infrastructure is fully converged. In the log, look for:
terraform plan -input=false -out=idempotency.tfplan -detailed-exitcode— The idempotency checkIdempotent, no changes detected.— Confirms the configuration is stable
If instead you see Idempotency test failed — changes detected!, it means Terraform wants to make additional changes even though it just applied. This usually indicates a provider bug, a resource that drifts on apply, or an ordering issue. Review the idempotency_plan.txt artifact to see what changes were detected.
7. Notify
Section titled “7. Notify”The notify stage sends pipeline results to a Webex Teams space (if configured). There are two separate jobs:
- success — Runs only when all previous stages passed. Look for the Webex message confirmation in the log.
- failure — Runs only when any previous stage failed. Sends an alert with failure details.
If the WEBEX_ROOM_ID and WEBEX_TOKEN variables are not configured, these jobs will fail silently — this is expected in lab environments where Webex notifications are optional.